Activity feedback
I gave at least a half mark for any submission, but next time, incomplete submissions will receive a zero.
- You need to use the template from the
isdaspackage. - You need to submit knitted PDFs.
- You should finish all the coding parts in the lab activities submission.
- You need to answer all the questions in the activity sections (highlights and threshold concepts are optional) in the in-class activity submission.
- Some submissions have errors in the YAML header, causing the PDF to not use the correct template.
- We have two activities each week, and you need to submit both in each submission.
- You need to submit both PDFs in the same submission.
Line breaks in markdown
Simply changing a line in Markdown won’t create a line break.
Unlike \(\LaTeX\) (\newline) or HTML (<br>), Markdown does not have explicit line break syntax.
The following example would produce a single line sentence after knitting:
In Markdown, line breaks are created implicitly using empty lines.
The following example would produce two lines after knitting:
Packages we use today
Load the following three packages.
If you have trouble restoring the reproducible environment, you need to manually install the packages first.
New package for today: spatstat
spatstat is an R package for spatial statistics with a strong focus on analyzing spatial point patterns in 2D.
You can find documentation for this package at:
Random vs. deterministirc process
Let’s denote the probability of an event occurring at point \((x,y)\) as \(Prob(Event_{(x,y)})\). The points are located within a unit square ranging from 0 to 1.
- A random process: \(Prob(Event_{(x,y)}) = B(n = 1, p = 0.5)\)
- A deterministic process:
\(Prob(Event_{(x,y)}) = x\) - A stochastic process: \(Prob(Event_{(x,y)}) = x - x \cdot B(n = 1, p = 0.5)\)
Generate random values from a distribution
There is a family of functions that start with r* capable of generating random values from a given distribution.
From a nomral distribution:
From a binomial distribution:
These functions are very useful for simulations.
Random number generator and seed
In computers, there is no true random number generator; they all use pseudo-random number generators. This means that the random numbers produced by computers are just the output of a very complex function based on an input, or seed.
As a result, if we know the seed, we can perfectly predict the random numbers generated by a computer’s random number generator.
Typically, computers use the current time as the seed (R uses this approach).
Setting a seed in R
You can control the random number generation algorithm by setting a seed value in R.
[1] 1 0 0 0 1[1] 1 0 0 0 1Note that the seed in R is actually a vector, a sequence of values, and set.seed changes this vector to a particular state.
If you do not set the seed again before rerunning the second rbinom, it will produce different results.
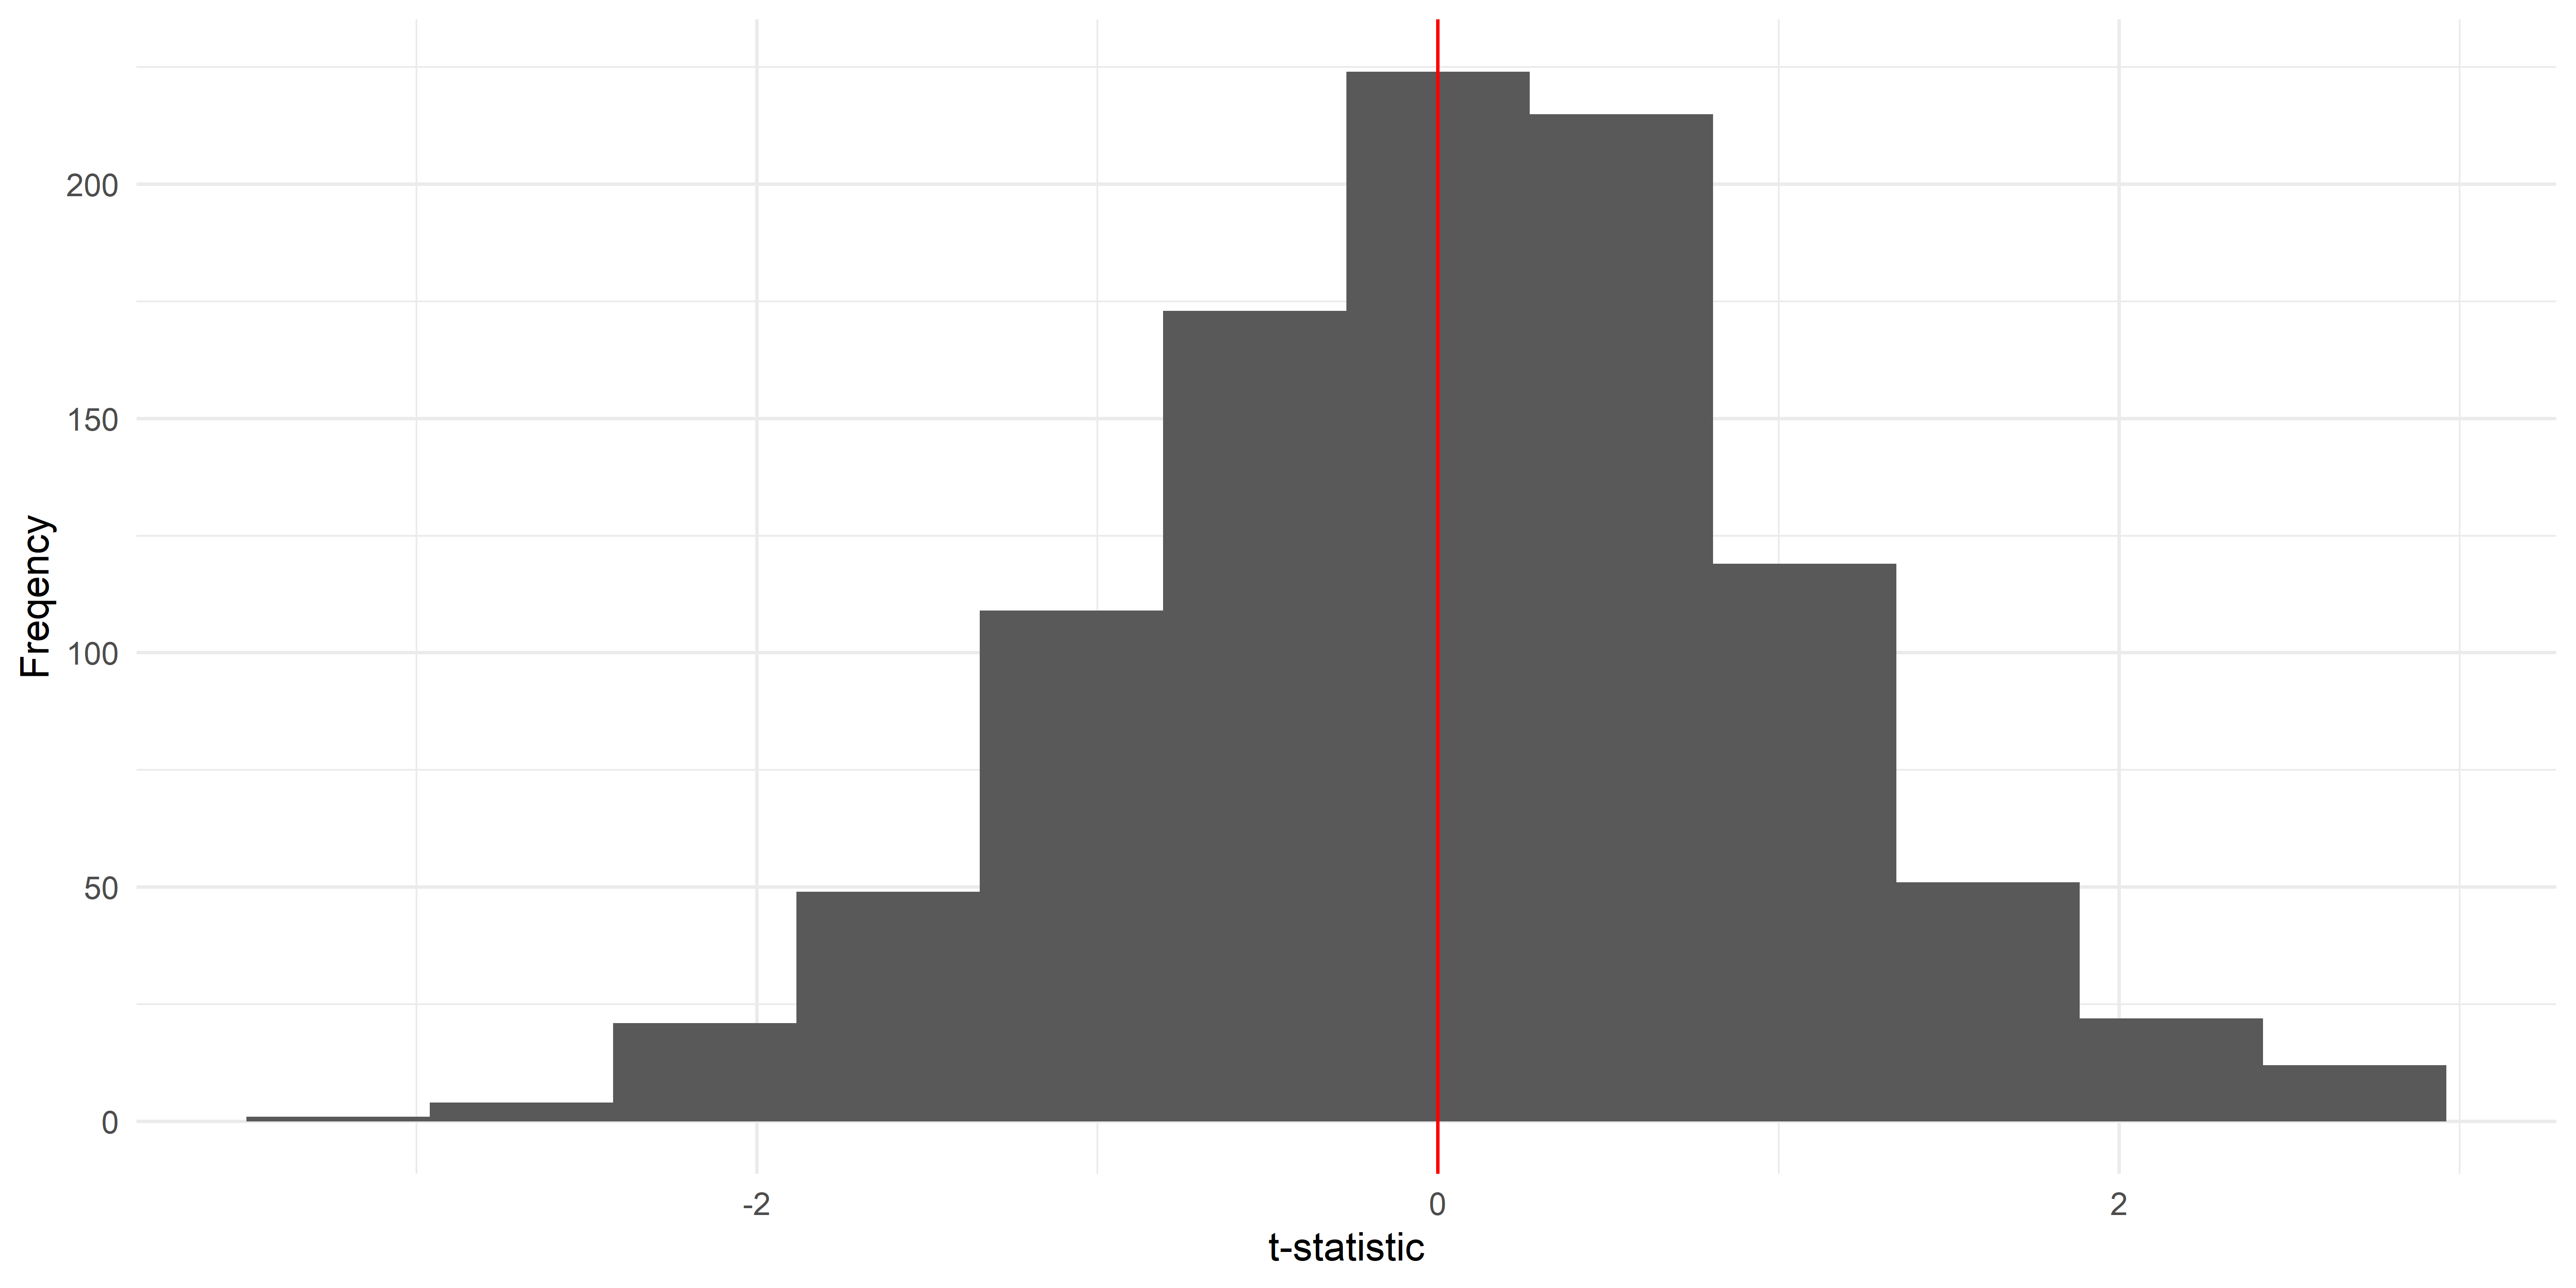
What is \(p\)-value?
Let’s say we have two samples from two different distributions. We want to perform a statistical test to compare their means (\(H_1: \overline{x_1} \neq \overline{x_2}\)). The \(p\)-value is the area under the curve that is more extreme than the test statistic, multiplied by 2.
Activities for today
2025 Zehui Yin