Spatial autocorrelation
Everything is related to everything else, but near things are more related than distant things.
—Tobler, W. R.
Global Moran’s \(I\)
\[ I = \frac{n \sum_i \sum_j w_{ij}(Y_i - \overline Y)(Y_j - \overline Y)} {(\sum_{i \neq j} w_{ij}) \sum_i (Y_i - \overline Y)^2} \]
When we use a row-standardized spatial weight matrix, \(W^{st}\), and denote \(z_i \equiv (Y_i-\overline{Y})\):
\[ I = \frac{\sum_{i=1}^n{z_i\sum_{j=1}^n{w_{ij}^{st}z_j}}}{\sum_{i=1}^{n}{z_i^2}} \]
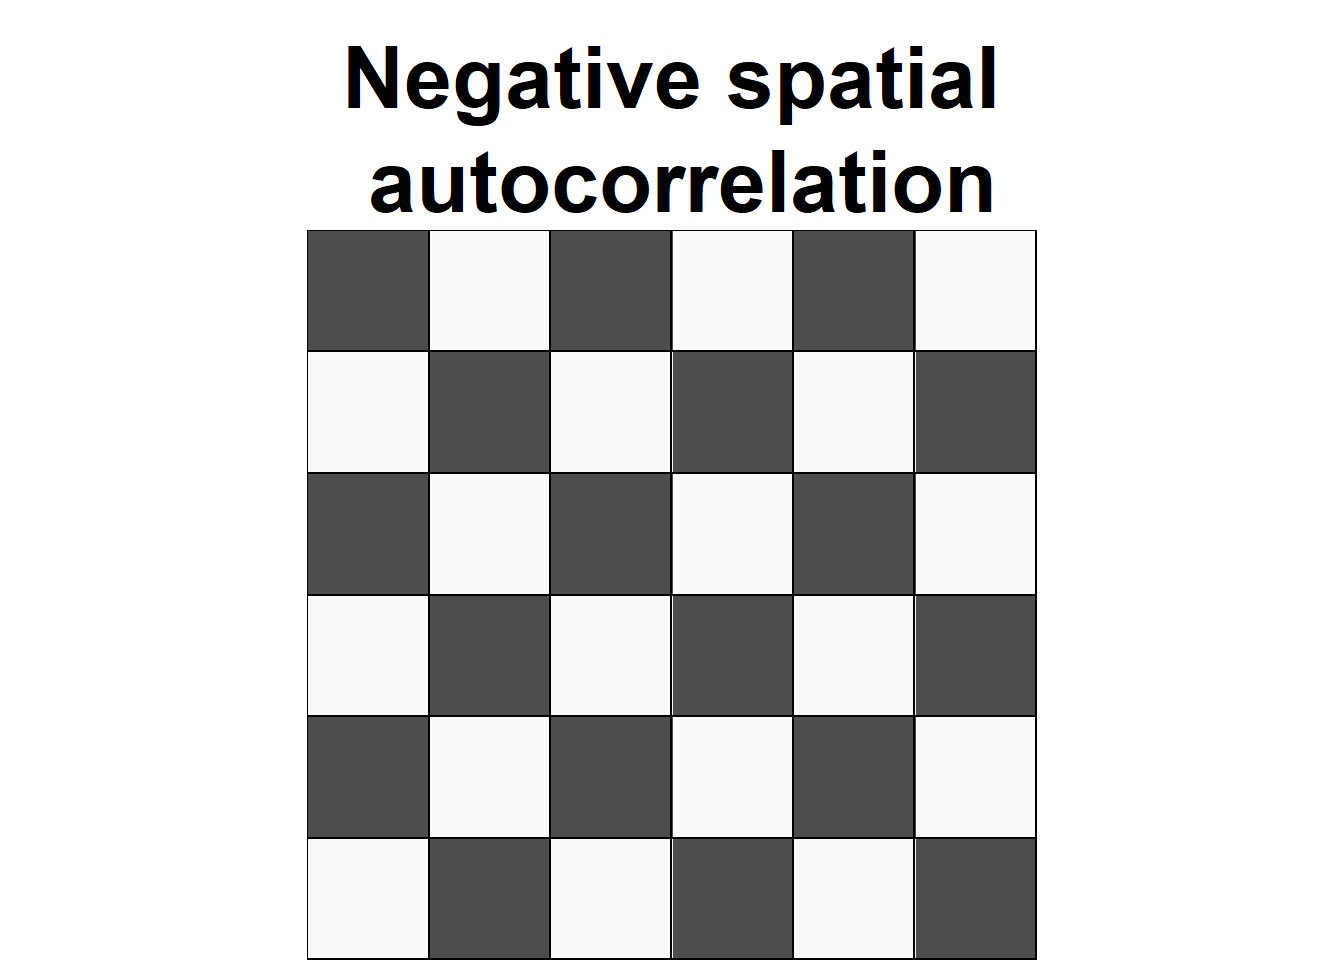
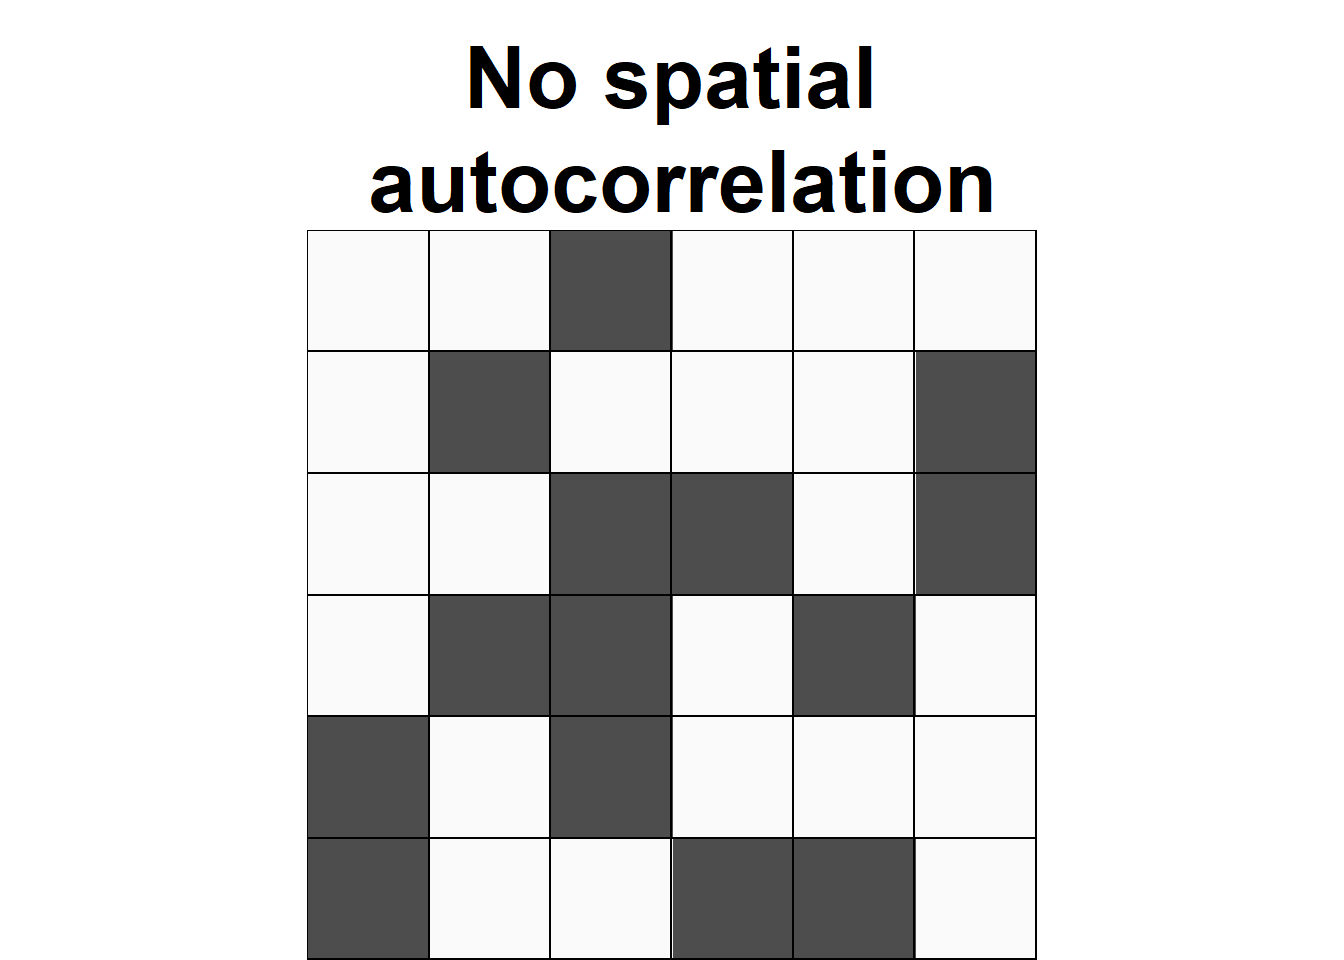
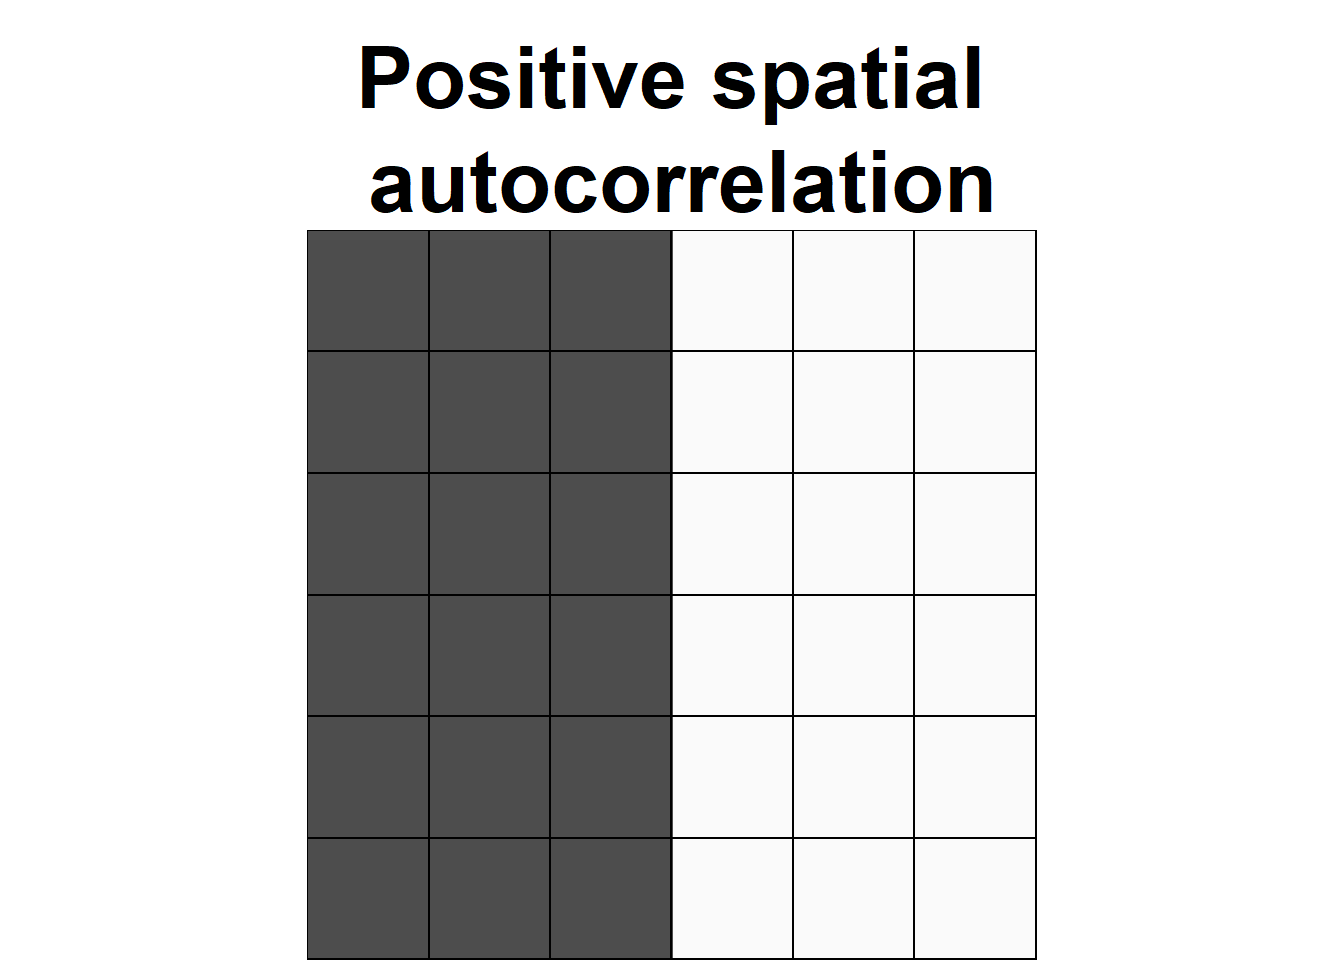
Global Moran’s \(I\) interpretation
- Moran’s \(I\) values usually range from –1 to 1.
- Values significantly above the expected value indicate positive spatial autocorrelation or clustering.
- Values significantly below the expected value indicate negative spatial autocorrelation or dispersion.
Local Moran’s \(I\)
\[ I_i = \frac{n (Y_i - \bar Y)}{\sum_j (Y_j - \bar Y)^2} \sum_j w_{ij}(Y_j - \bar Y) \]
Noting that
\[ I = \frac{1}{\sum_{i \neq j} w_{ij}}\sum_i I_i \]
When we use a row-standardized spatial weight matrix, \(W^{st}\), we have \(I = \frac{\sum_i I_i}{n} = \overline{I_i}\).
Multiple testing
The \(\alpha\) in hypothesis testing is the probability of making a type I error (false positive).
In our context, it means concluding that a truly random spatial pattern is non-random, thus rejecting the null hypothesis.
When running multiple tests simultaneously using overlapping information, we are more likely to encounter these types of errors purely due to chance.
Therefore, we must adjust \(p\)-values (downward) to ensure that we maintain the desired \(\alpha\) level.
One way to do this is Bonferroni correction: \(\alpha_{adjusted}=\frac{\alpha}{m}\), where \(m\) is the number of simultaneous tests.
plotly package
The plotly package in R is a binding to the open-source JavaScript graphing library, plotly.js. It excels at creating interactive web graphics, including maps and figures.
However, it does not support knitting the Rmd file into a PDF since PDFs are static files, unlike HTML outputs.
To include plotly graphics in a knitted PDF, take a screenshot of the output and insert the screenshot as a static image in the PDF file:
Functions in R recap
Functions in R use the following syntax. Note that any thing wrapped in <...> indicates that it is just a name and can be called anything you like.
You only need to define functions once in your code. Then, you can call it by its name.
Activities for today
Reference
2025 Zehui Yin