Toward Equitable Service Provision
A Catchment Area Analysis of The Bike Share Toronto System
Zehui Yin, Shixiang Xing, and Filip Panaitescu
University of Toronto Scarborough
2024-04-30
About Me
- Undergraduate Student at University of Toronto Scarborough (UTSC)
- Major in Economics for Management Studies
- Minor in GIS and Applied Statistics
- Research Assistant in the Suburban Mobility Cluster at Department of Human Geography at UTSC
- Incoming Geography PhD Student at McMaster University this Fall
The Team and Project
- 3 Undergraduate Students at UTSC
- This project was completed for the course GGRD30H3: GIS Research Project at UTSC in Winter 2024.
- Supervised by Dr. Glenn Brauen, Associate Professor, Department of Human Geography at UTSC
Table of Contents
- Background and Motivation
- Research Questions
- Data and Method
- Catchment Area Analysis
- Areal Weighted Interpolation
- Cluster Analaysis and Hotspot Analysis
- Suitability Analysis
- Results and Discussion
- Q&A
Background and Motivation
- In the past 20-30 years, cities around the world have increasingly taken an interest in expanding and promoting active mobility means and networks.
- Bike Share Toronto is Toronto’s official docked bike-sharing system, sponsored by Tangerine Bank since 2011.
- Bikeshare not only inherits the benefits of cycling but also provides additional incentives such as convenience and financial savings for its users.
Background and Motivation
- Bikeshare also faces challenges and barriers that may limit its accessibility and equity for diverse populations, especially due to its docked nature and the arising first and last-mile issues.
- Bikeshare has the potential to combat social exclusion by providing improved mobility options, but this requires careful operation and management.
Background and Motivation
- Different population groups are not uniformly distributed throughout the City.
- Bikeshare stations mostly are located in the downtown core of Toronto.
Research Questions
- How equitable is the access to Bike Share Toronto for all Toronto residents, especially for population subgroups based on gender, income or ethnicity?
- Which Bike Share Toronto service areas have higher or lower levels of equity, and where should the system expansion be prioritized to improve the service provision equity?
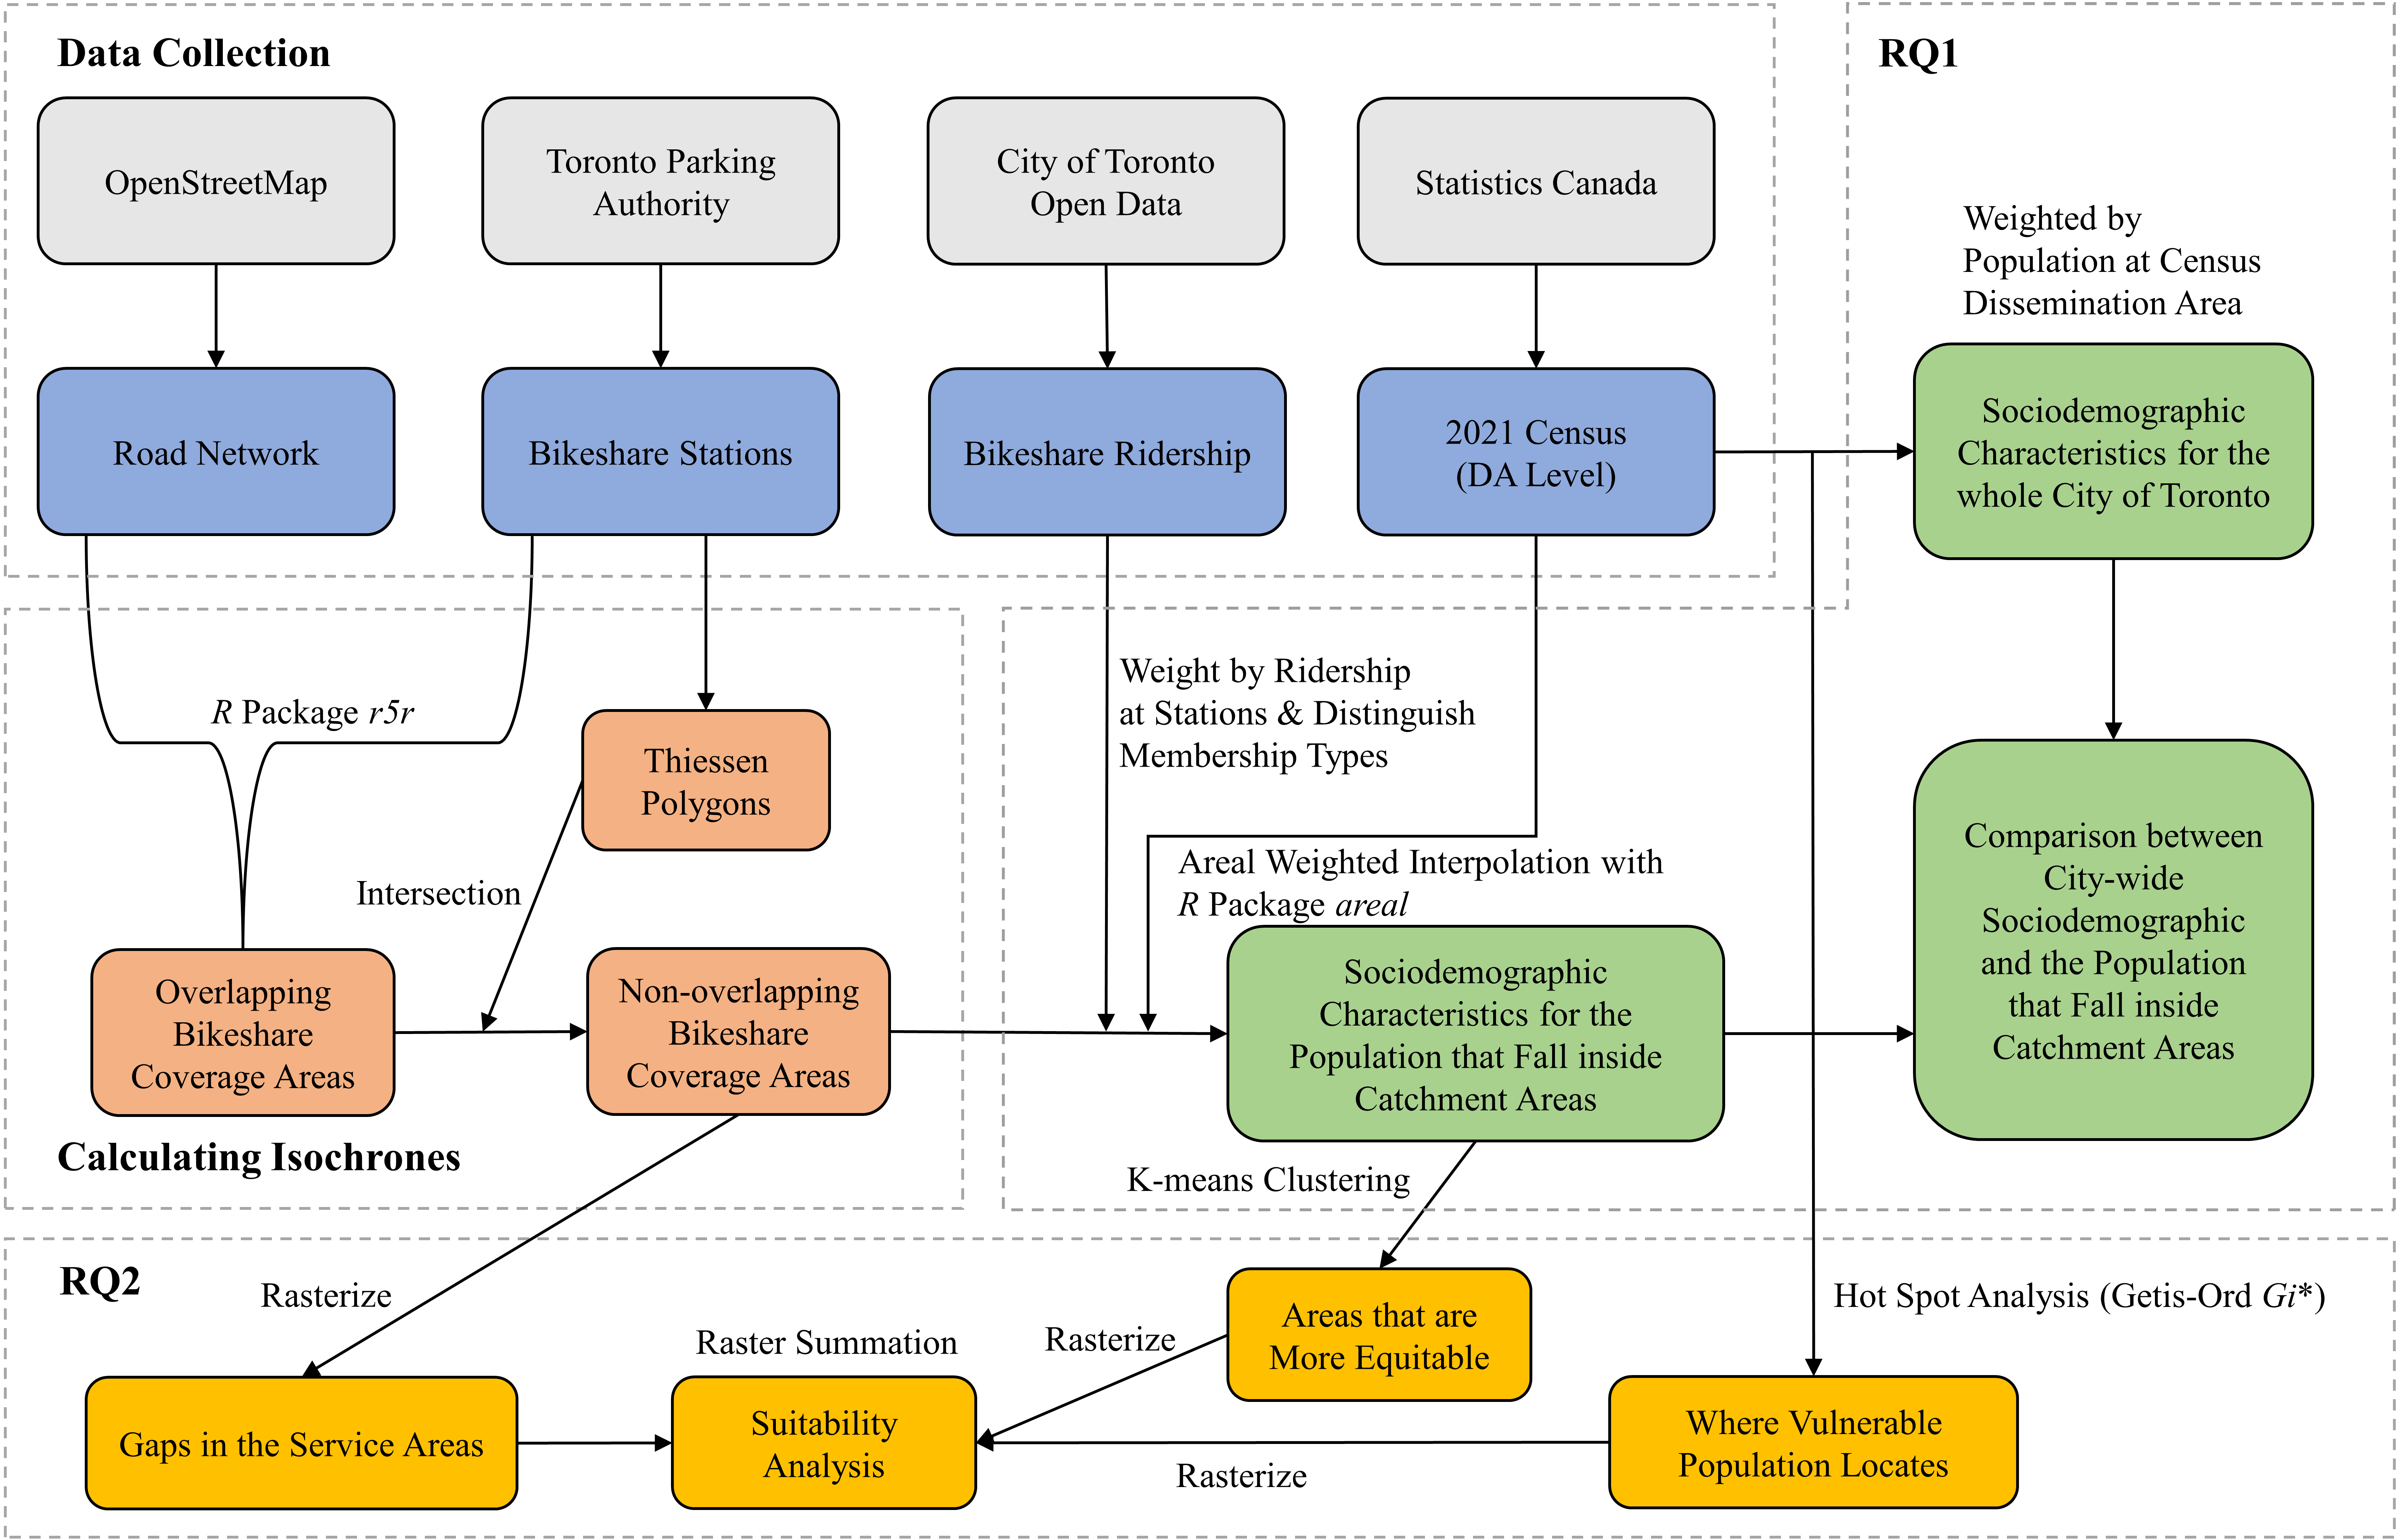
Data and Method
![]()
Catchment Area Analysis
- To measure the coverage area of each bike share station, we calculated the 15-minute walking distance network buffers around them, using the r5r package in R.
- To avoid overlapping in catchment areas, we created Voronoi polygons based on Euclidean distance for each station and intersected them with the network buffers to get the non-overlapping coverage areas for each bike share station.
Areal Weighted Interpolation
To construct metrics quantifying the service provision equity, we calculated 8 socio-demographic variables using 2021 Canadian Census Data: For each census dissemination area in the City of Toronto, the percentages of
- Females
- Indigenous people
- White people
- Chinese people
- Black people
- Latino people
- People with household total income below $40,000 in 2020
- People with household total income above $100,000 in 2020
Areal Weighted Interpolation
We used the areal package in R to reshape the census data into the non-overlapping coverage areas, using the areal weighted interpolation method.
![]()
![]()
Areal Weighted Interpolation
Formally, areal weighted interpolation involves four steps:
- Intersecting the non-overlapping coverage areas with the census dissemination areas.
- Calculating an areal weight for each intersected feature, using \(W_i=\frac{A_i}{\sum_i A_{ik}}\).
- Estimating the share of the population value that occupies the intersected feature, using \(E_i=V_j\times W_i\).
- Summarizing the data based on the target identification number, using \(G_k=\sum_i E_{ik}\).
Areal Weighted Interpolation
- The Toronto Bike Share system-wide socio-demographics were calculated as a weighted average based on ridership at each station, \(\overline{x}=\frac{\sum n\times x}{n}\).
- 2 types of riderships: annual, casual
- Annual riders only accounts for about 6.27% of the total trips in 2023.
- Similarly, Toronto city-wide average were calculated as a weighted average based on population count at each DA.
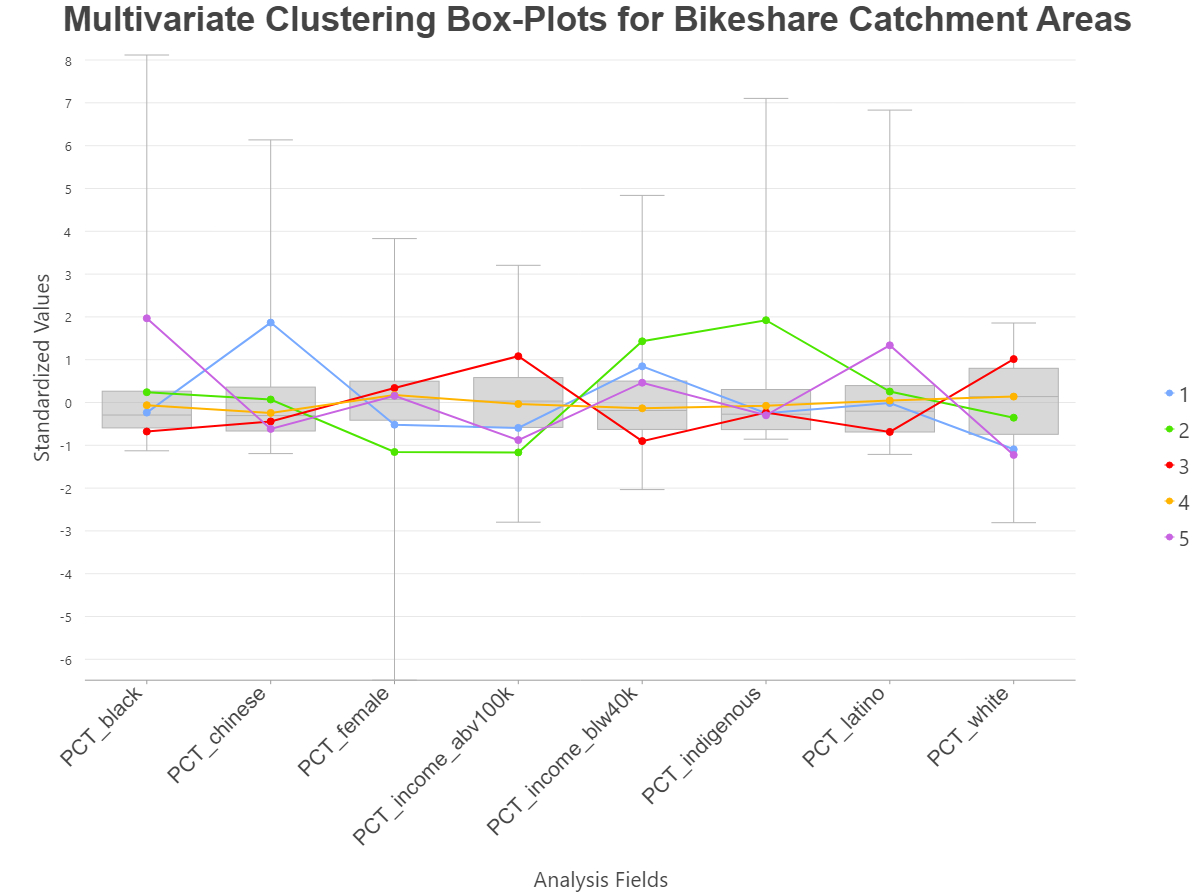
Cluster Analysis
- We applied the Multivariate Clustering Geoprocessing tool (K-means Clustering) in ArcGIS Pro to the 8 socio-demographic variables of the bike share stations in order to group them into 5 clusters based on their attribute similarities.
- From these five clusters, we identified existing catchment areas that are relatively more equitable compared to others.
Cluster Analysis
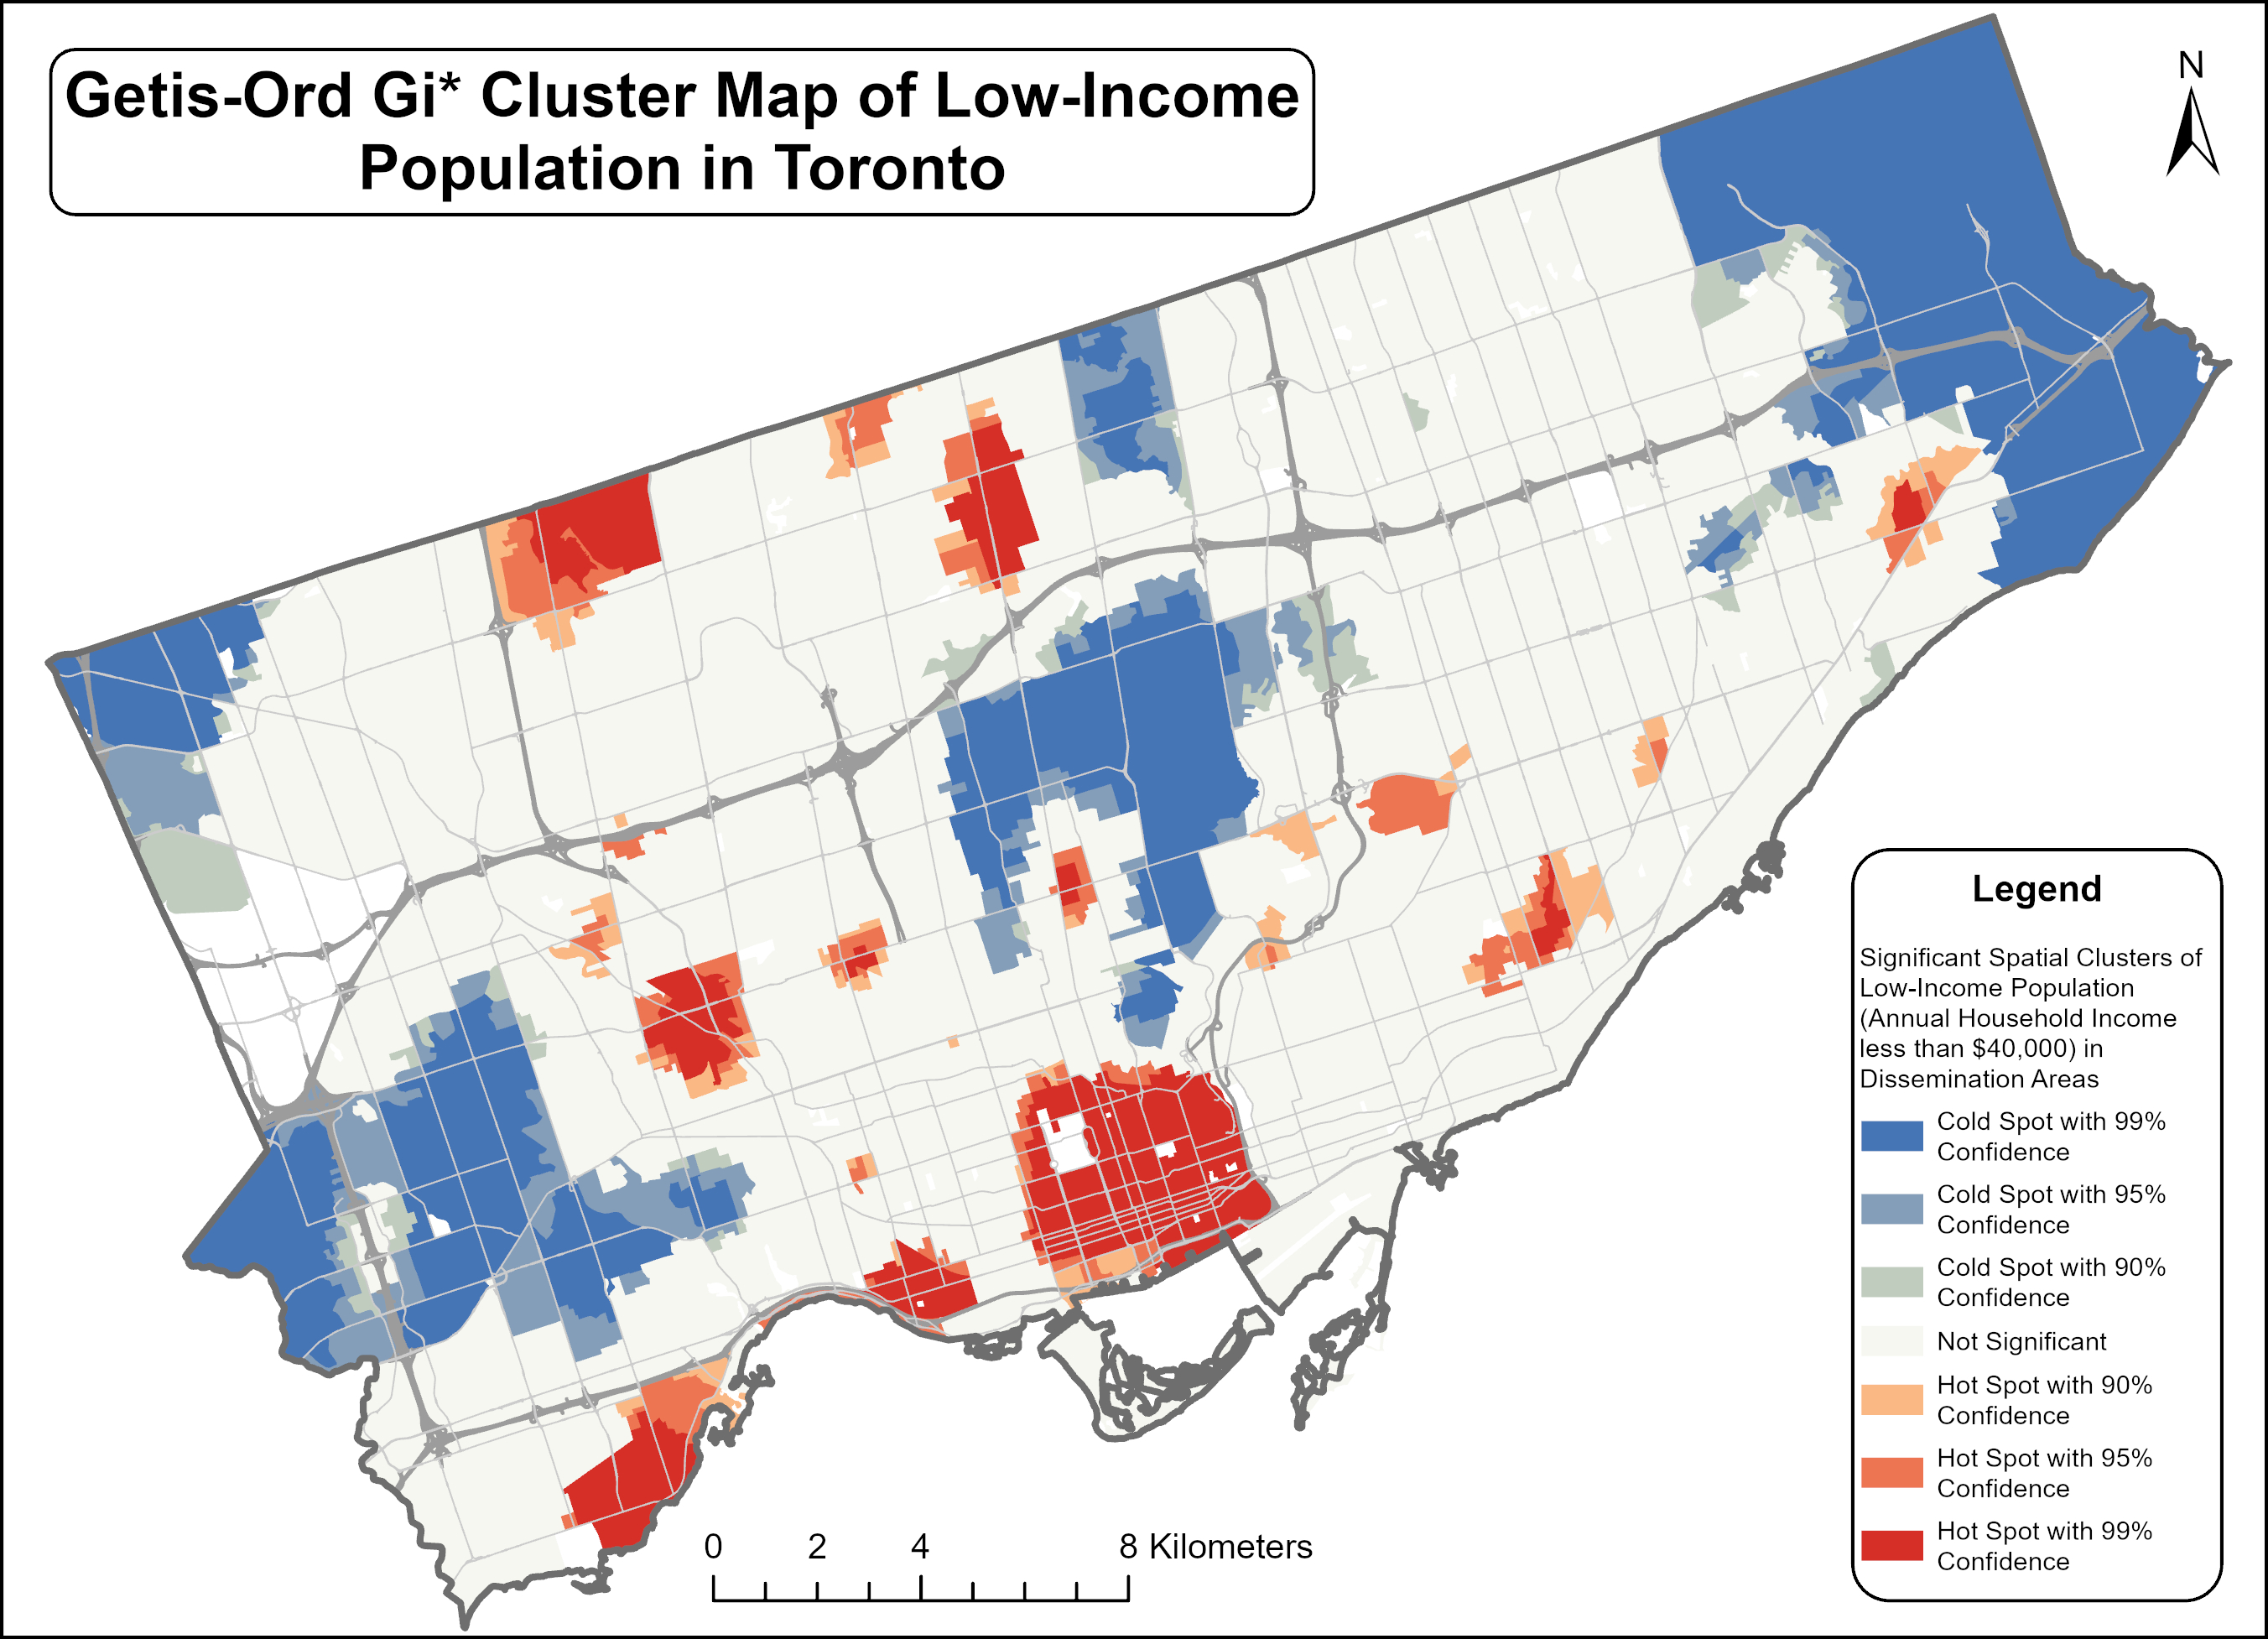
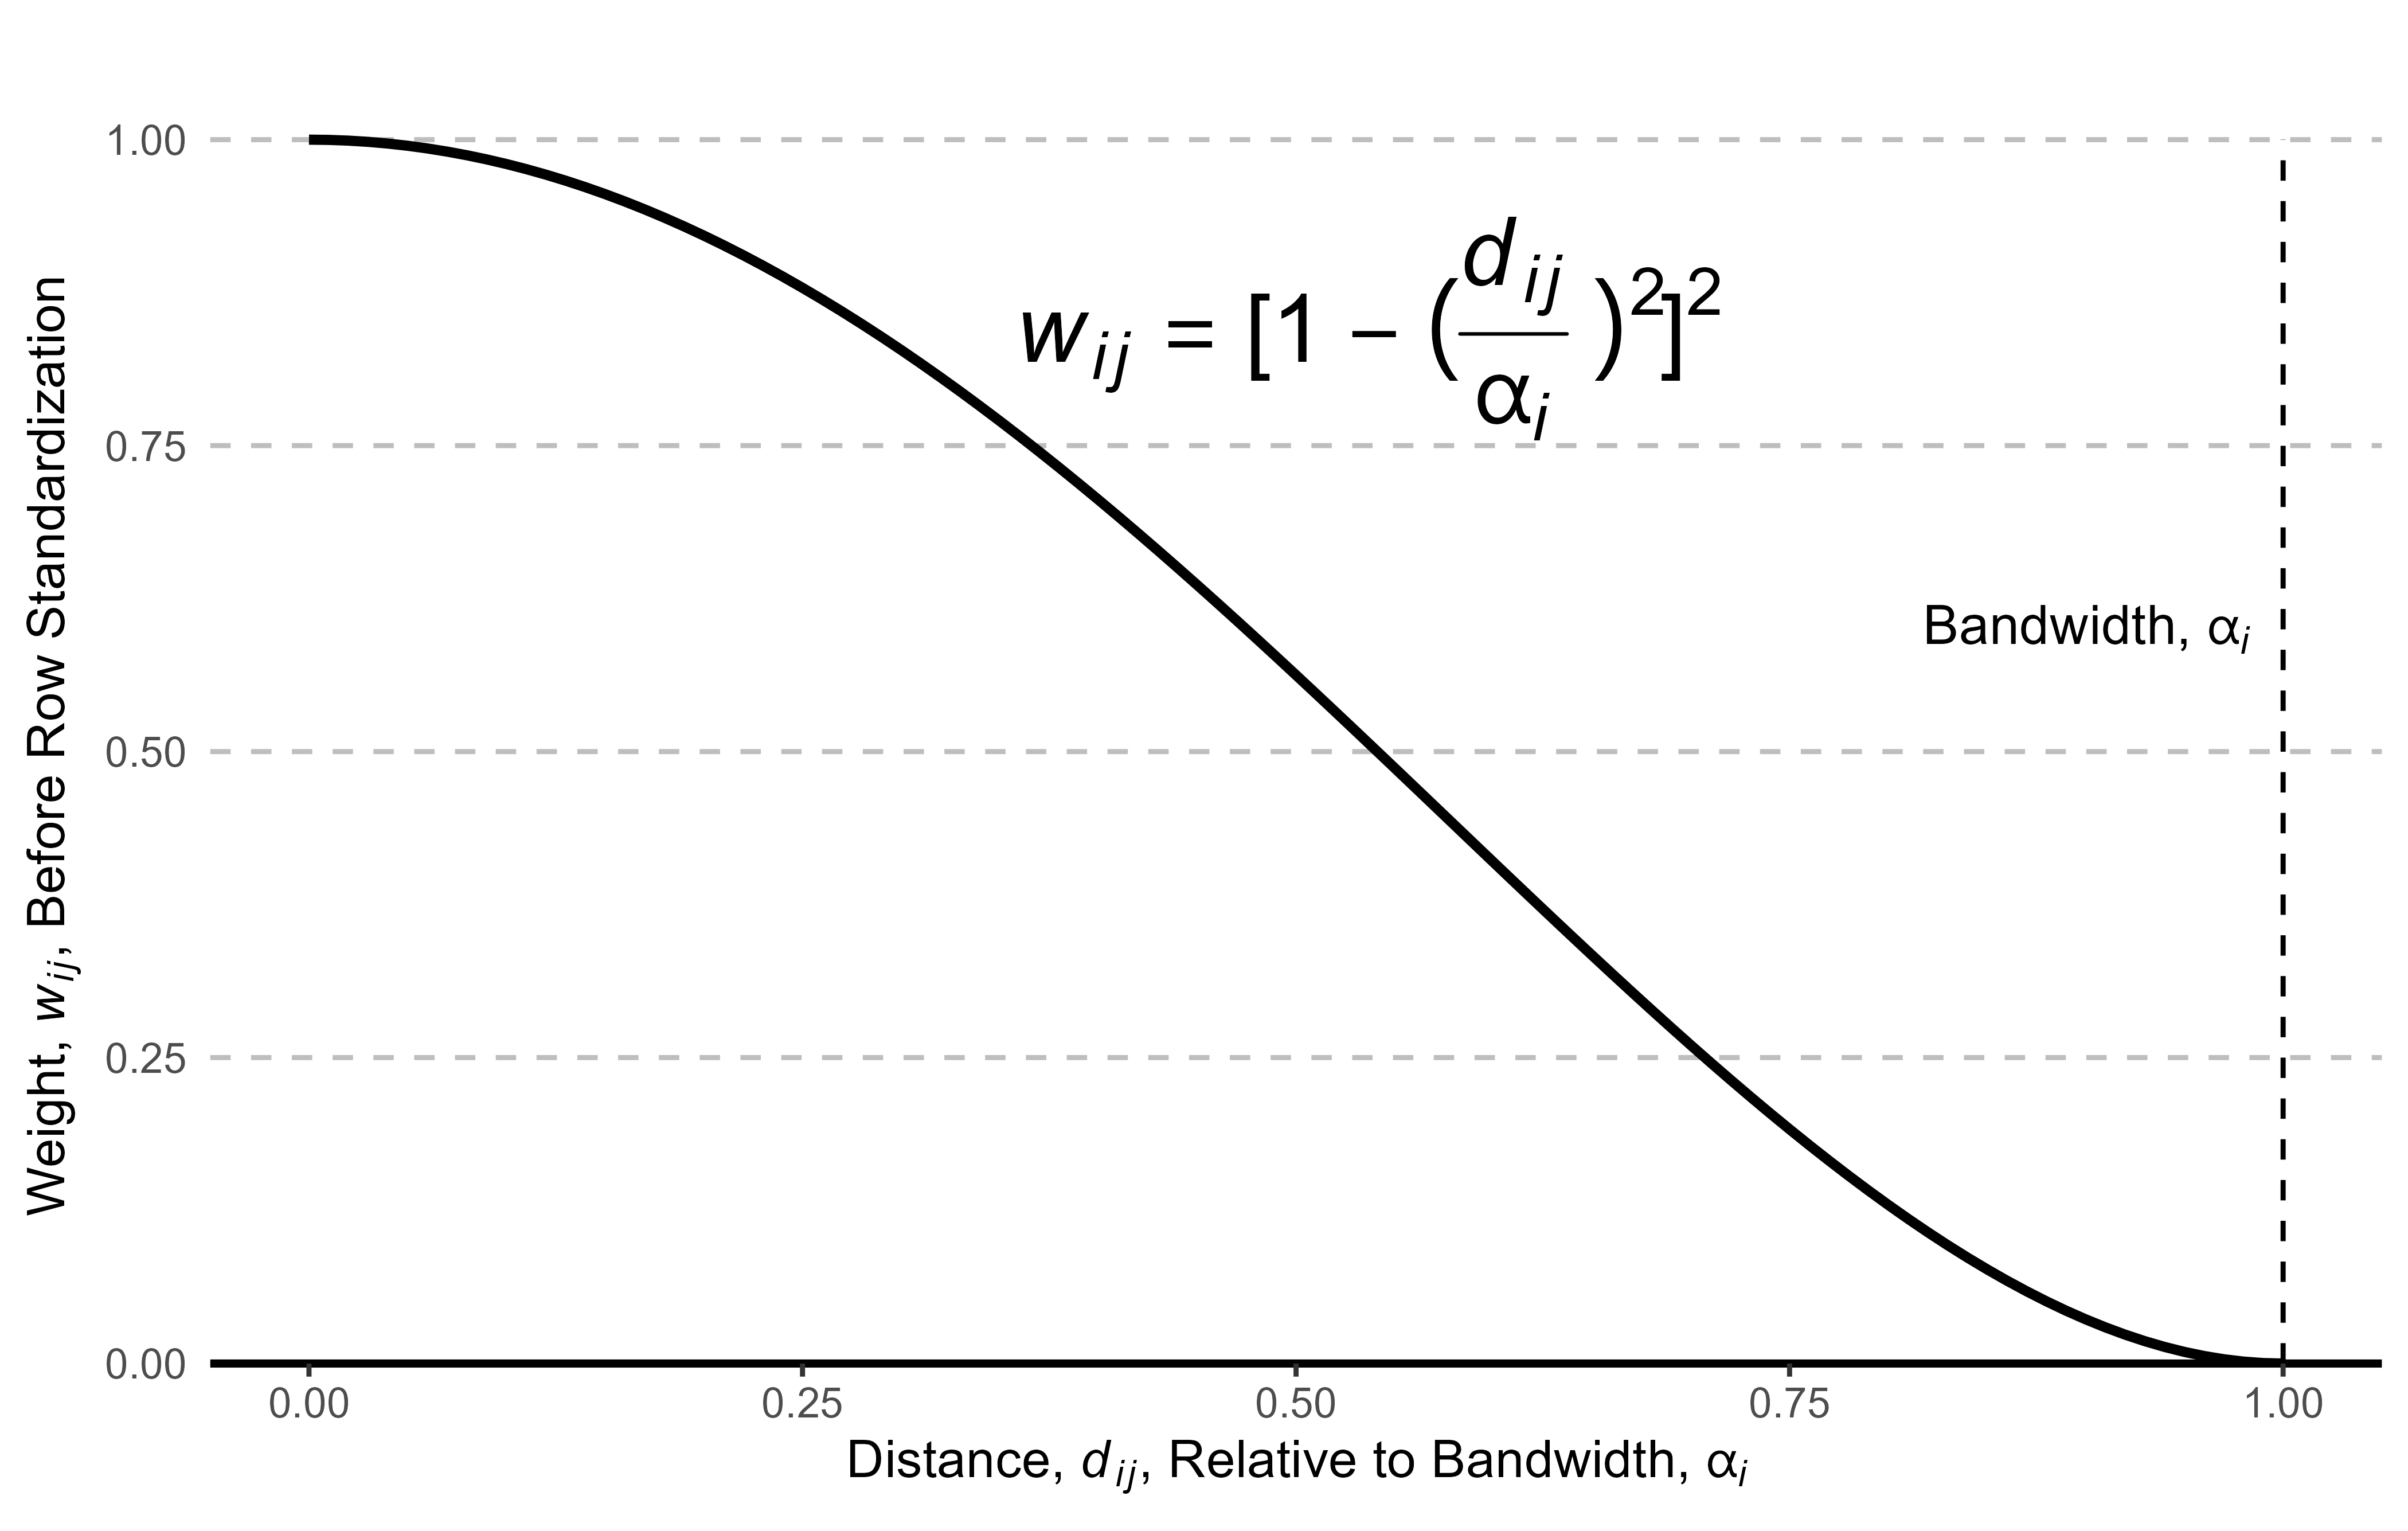
Hotspot Analysis
- We used Hotspot Analysis or Getis-Ord \(Gi^*\) to identify the census DAs that have high or low values of the socio-demographic variables, compared to the surrounding areas.
- We employed a spatial weight matrix constructed using the 40-nearest neighbours method, along with the row standardized Bisquare Kernel Function, \(w_{ij}=[1-(\frac{d_{ij}}{\alpha_i})^2]^2\) and \(\sum_j w_{ij}=1\).
Hotspot Analysis
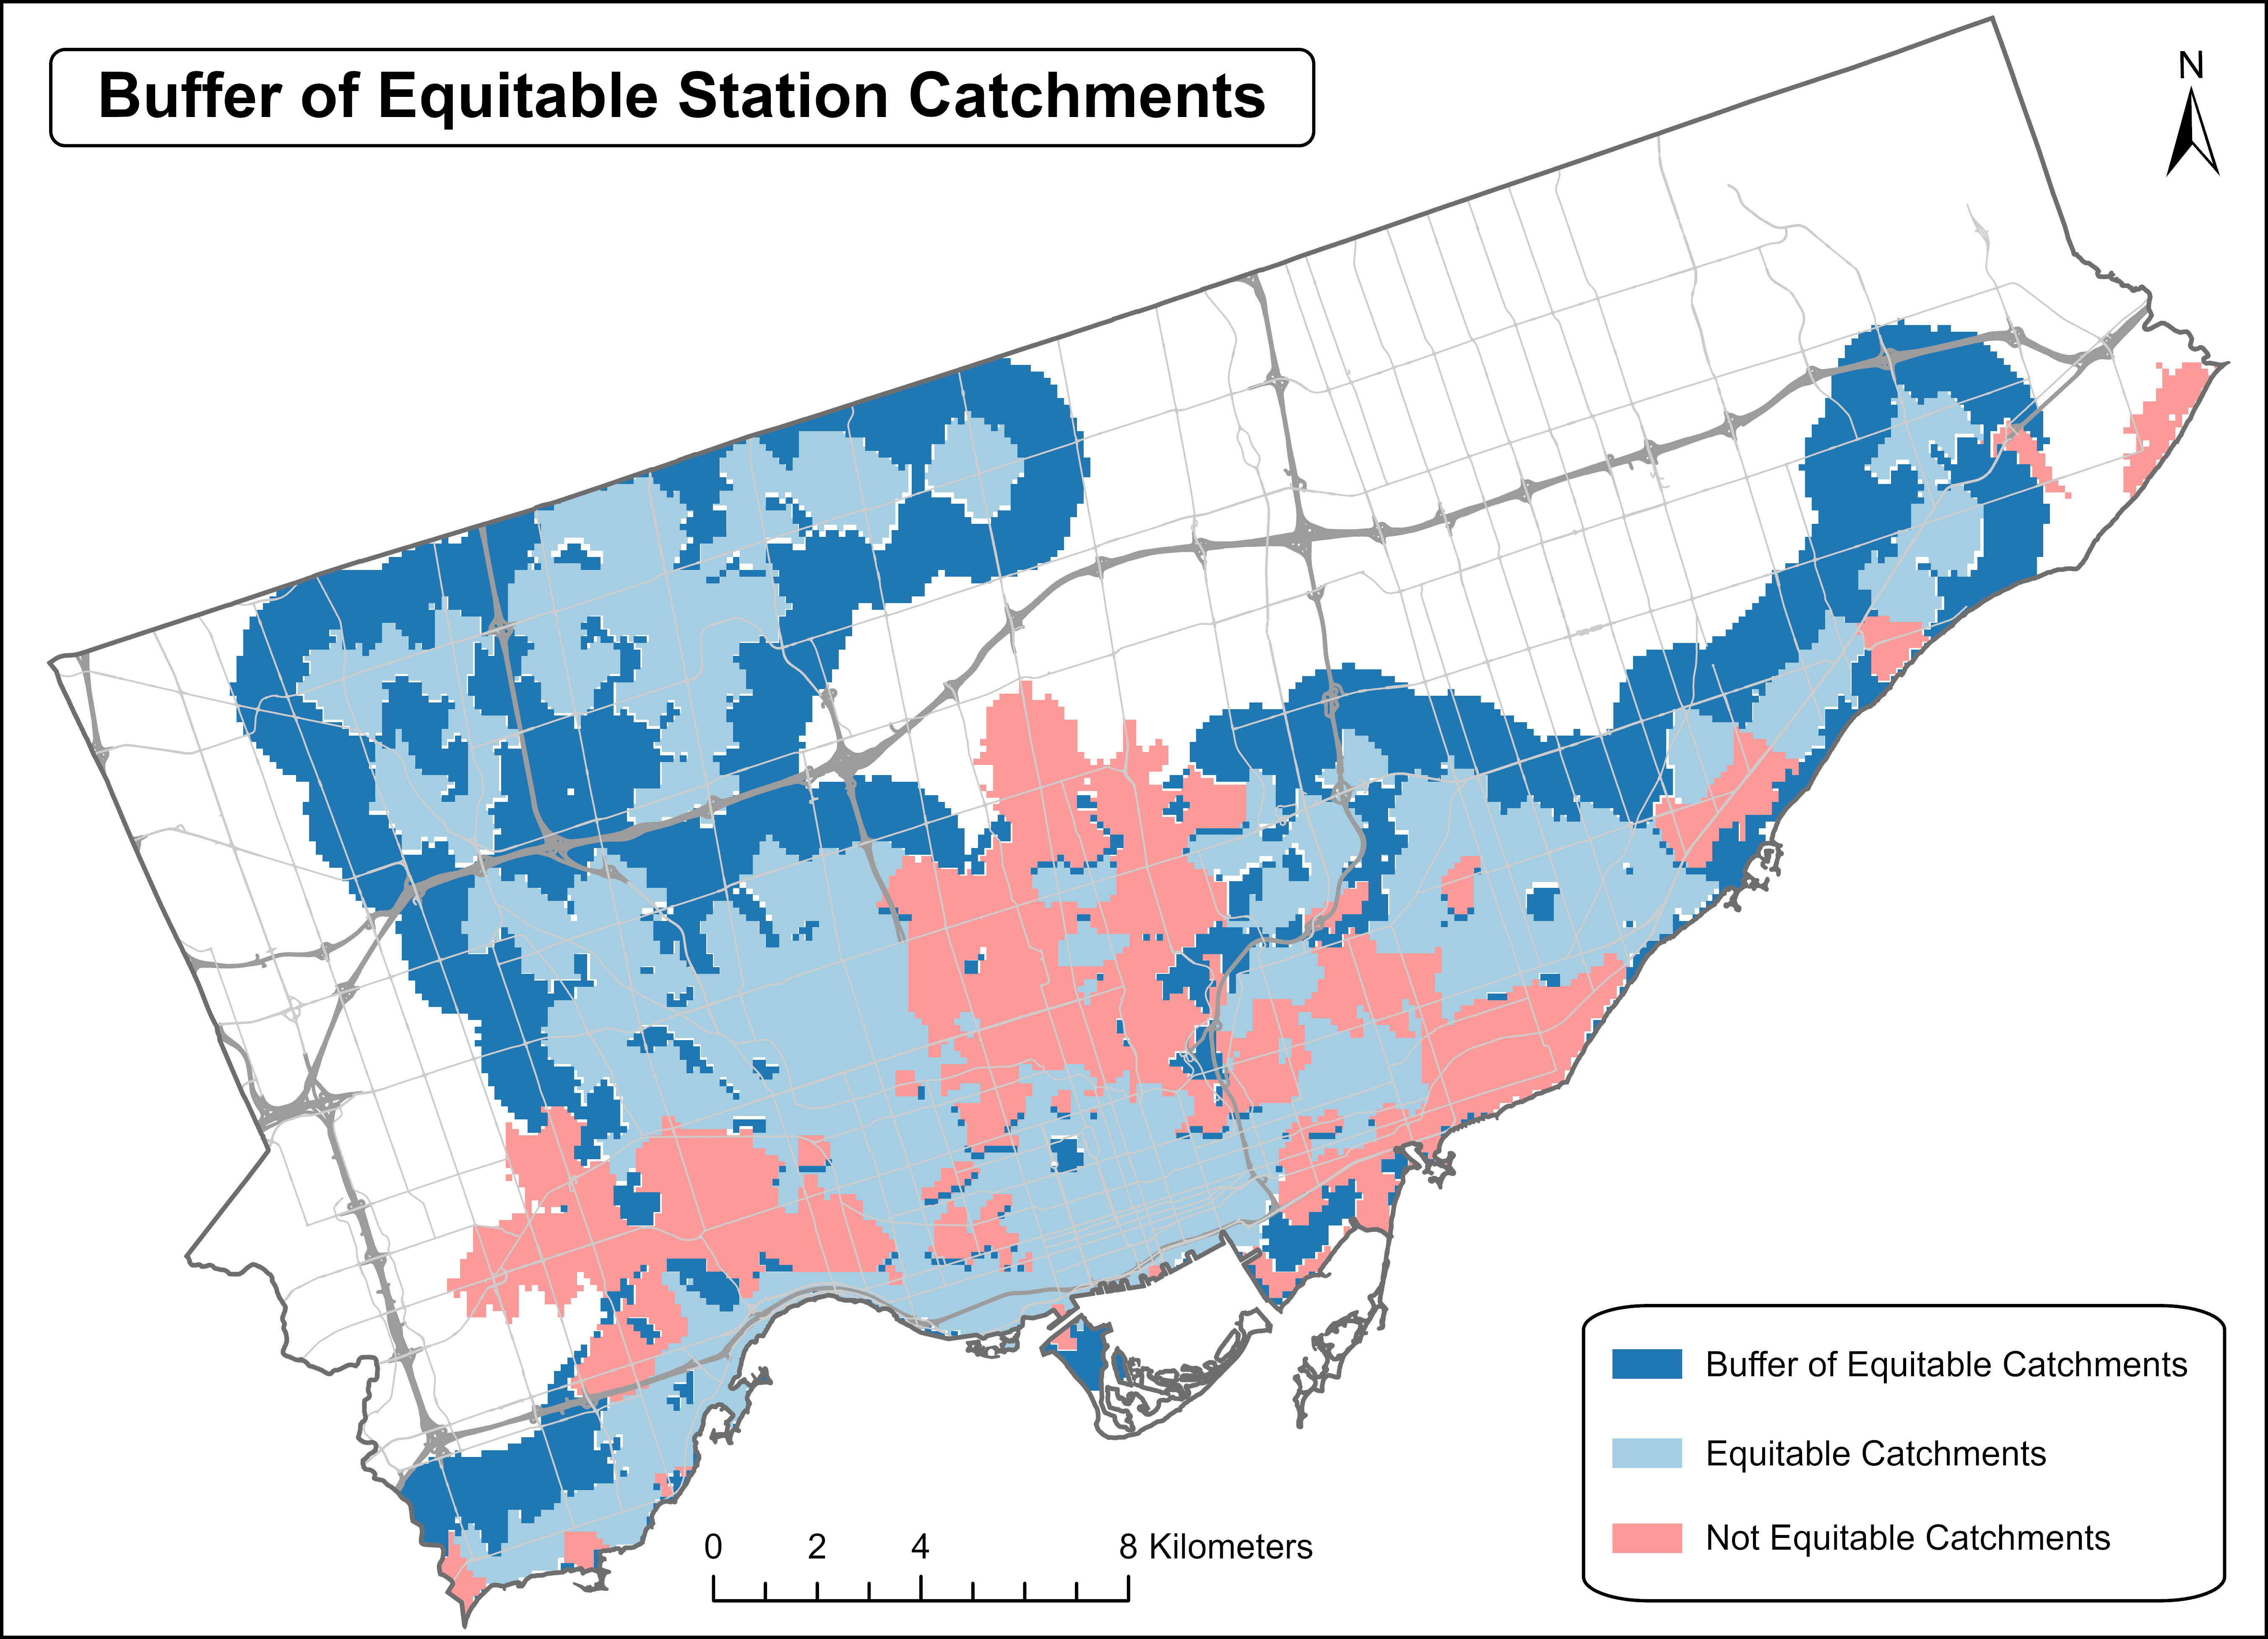
Suitability Analysis
We identified socio-demographic hotspots with a confidence level exceeding 90% and converted them into raster format, with cell values equal to the original socio-demographic variables.
We created an approximate 1-kilometre buffer zone raster around the equitable catchment areas identified by the cluster analysis.
Suitability Analysis
![]()
![]()
Suitability Analysis
We computed a weighted sum of these raster layers in ArcGIS Pro to ascertain the most suitable areas for the expansion of the Bike Share Toronto system.
The weights for the socio-demographic hotspot layers were set as the inverse of their respective means, \(w_i=\frac{1}{\mu_i}\).
The buffer layer was assigned a weight of 1.2 to balance the importance of proximity to existing stations against the need to serve underserved populations.
Results and Discussion
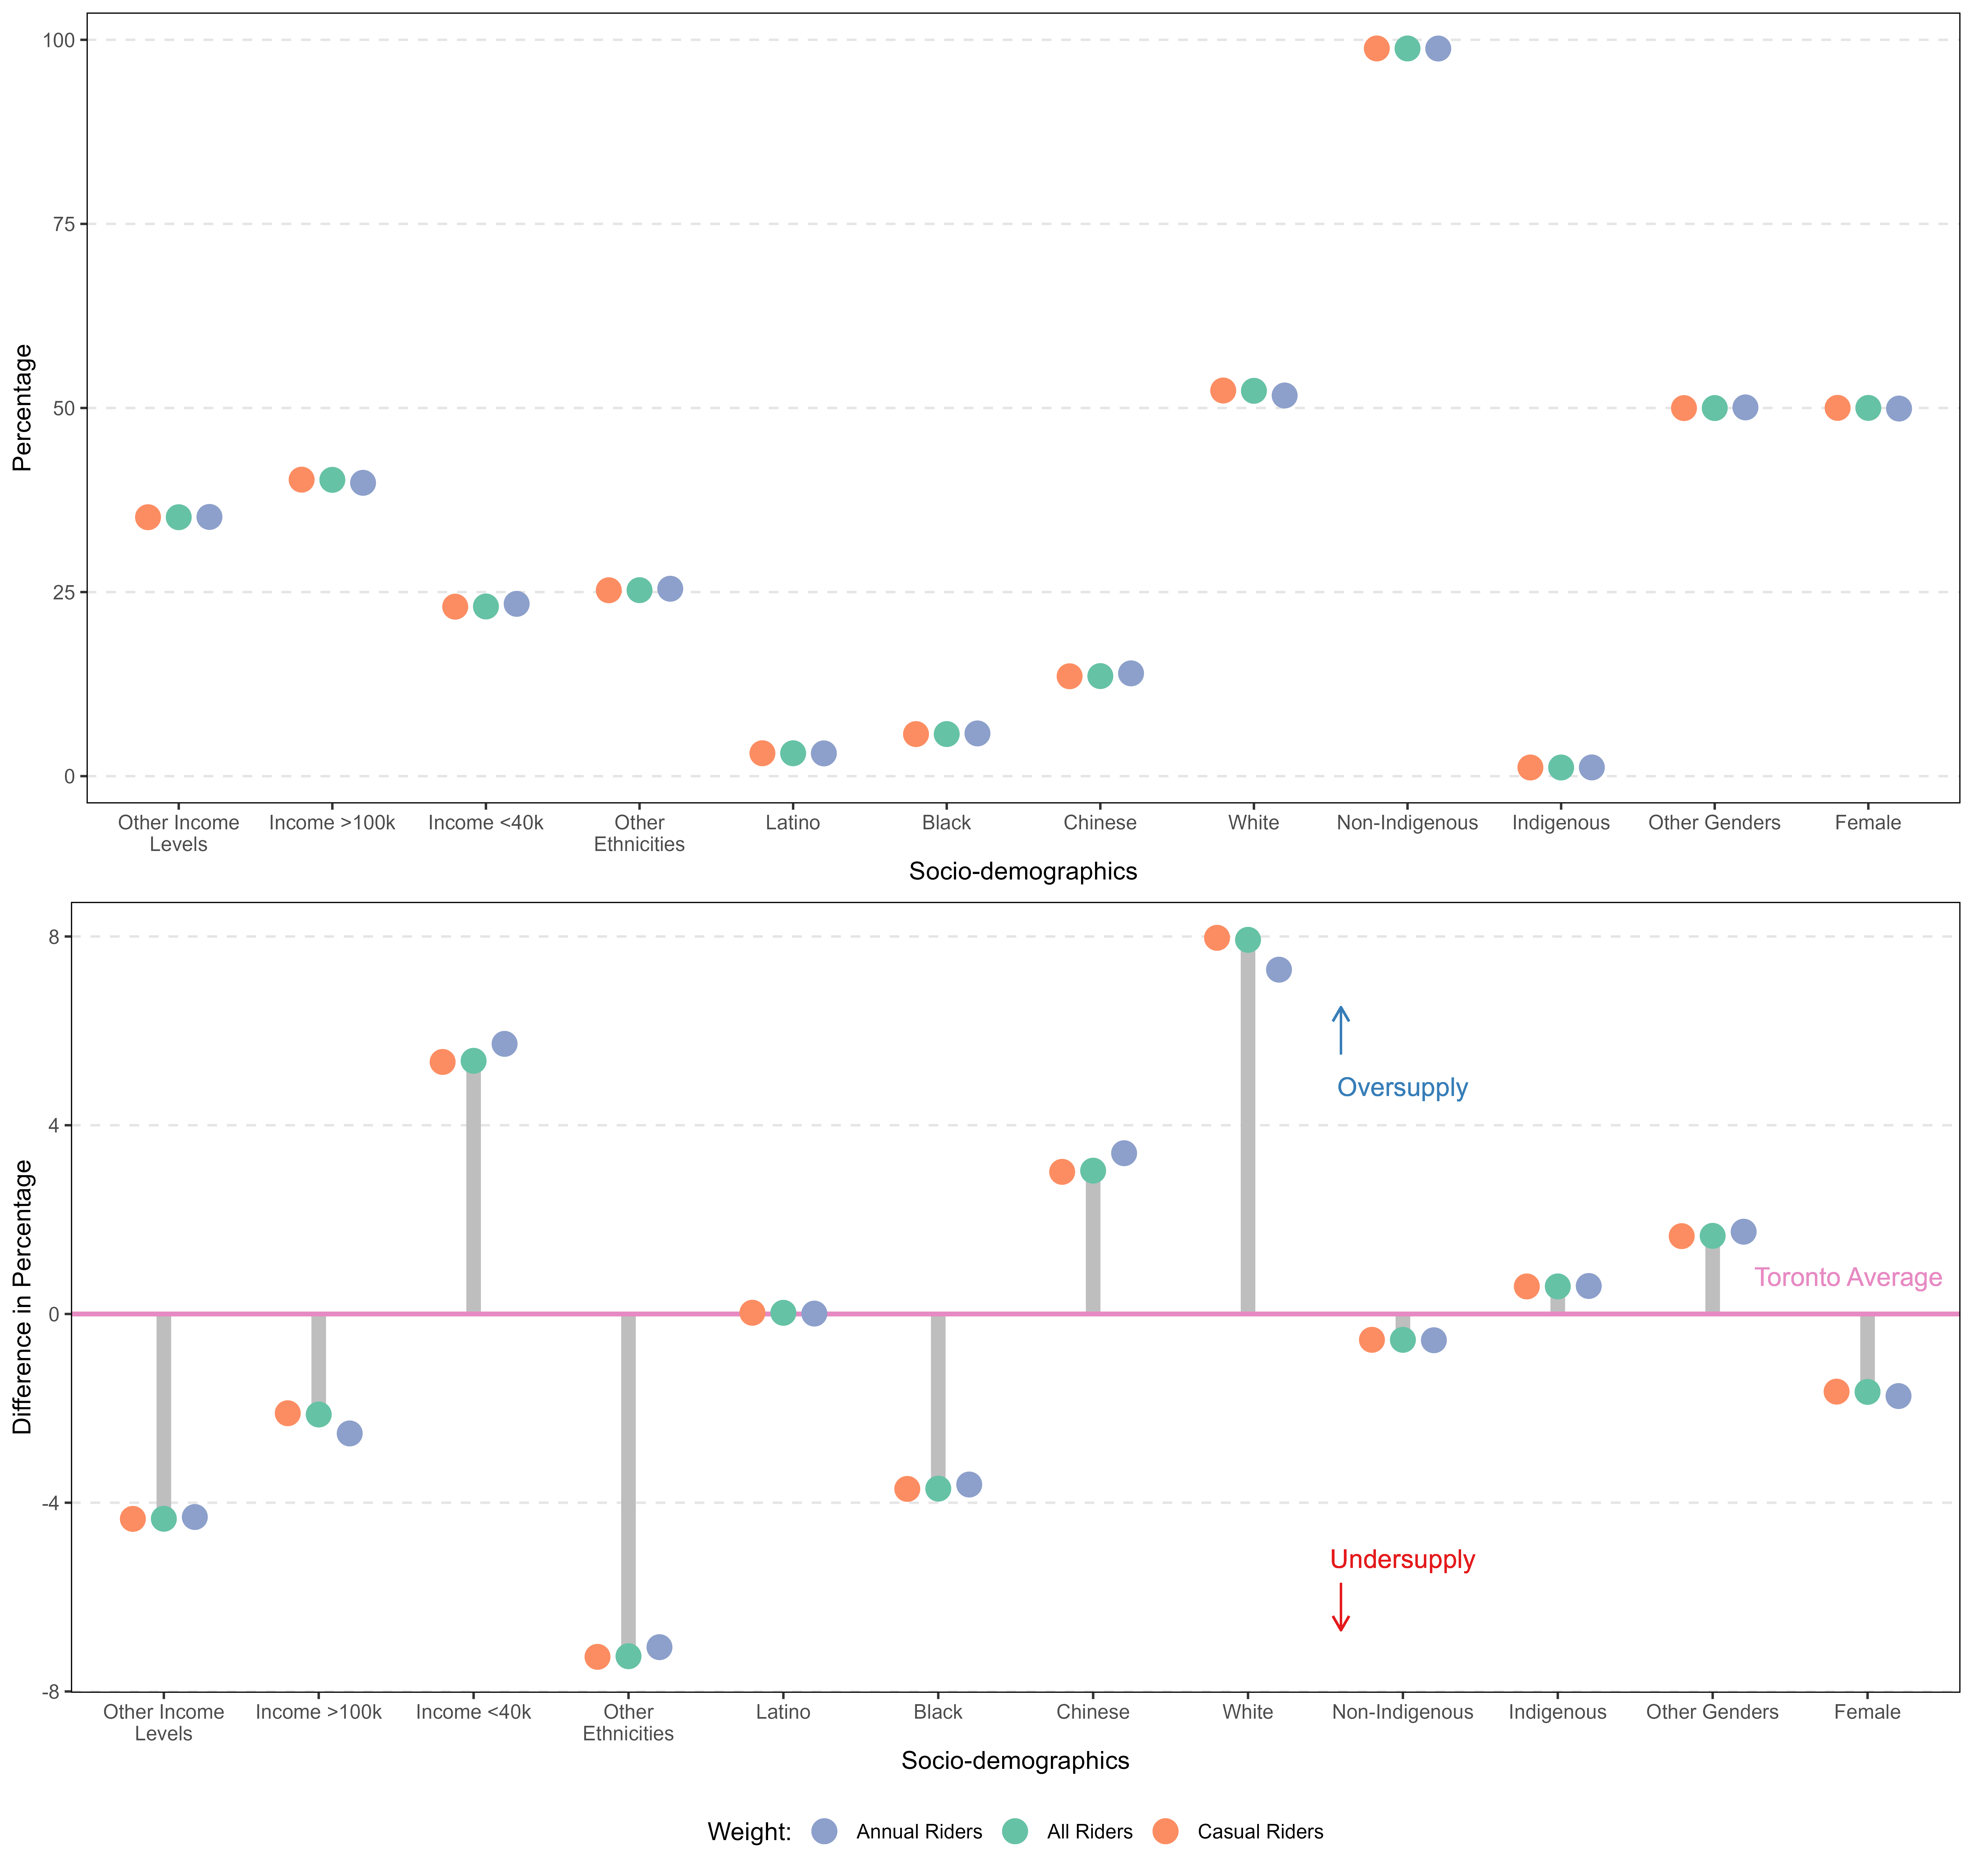
Results and Discussion
Employing catchment area analysis, we discovered disparities in service provision: an oversupply to White, Chinese, and low-income populations contrasted with an undersupply to Black and female demographics.
These findings indicate significant opportunities for enhancing the system’s equitable distribution of services.
Results and Discussion
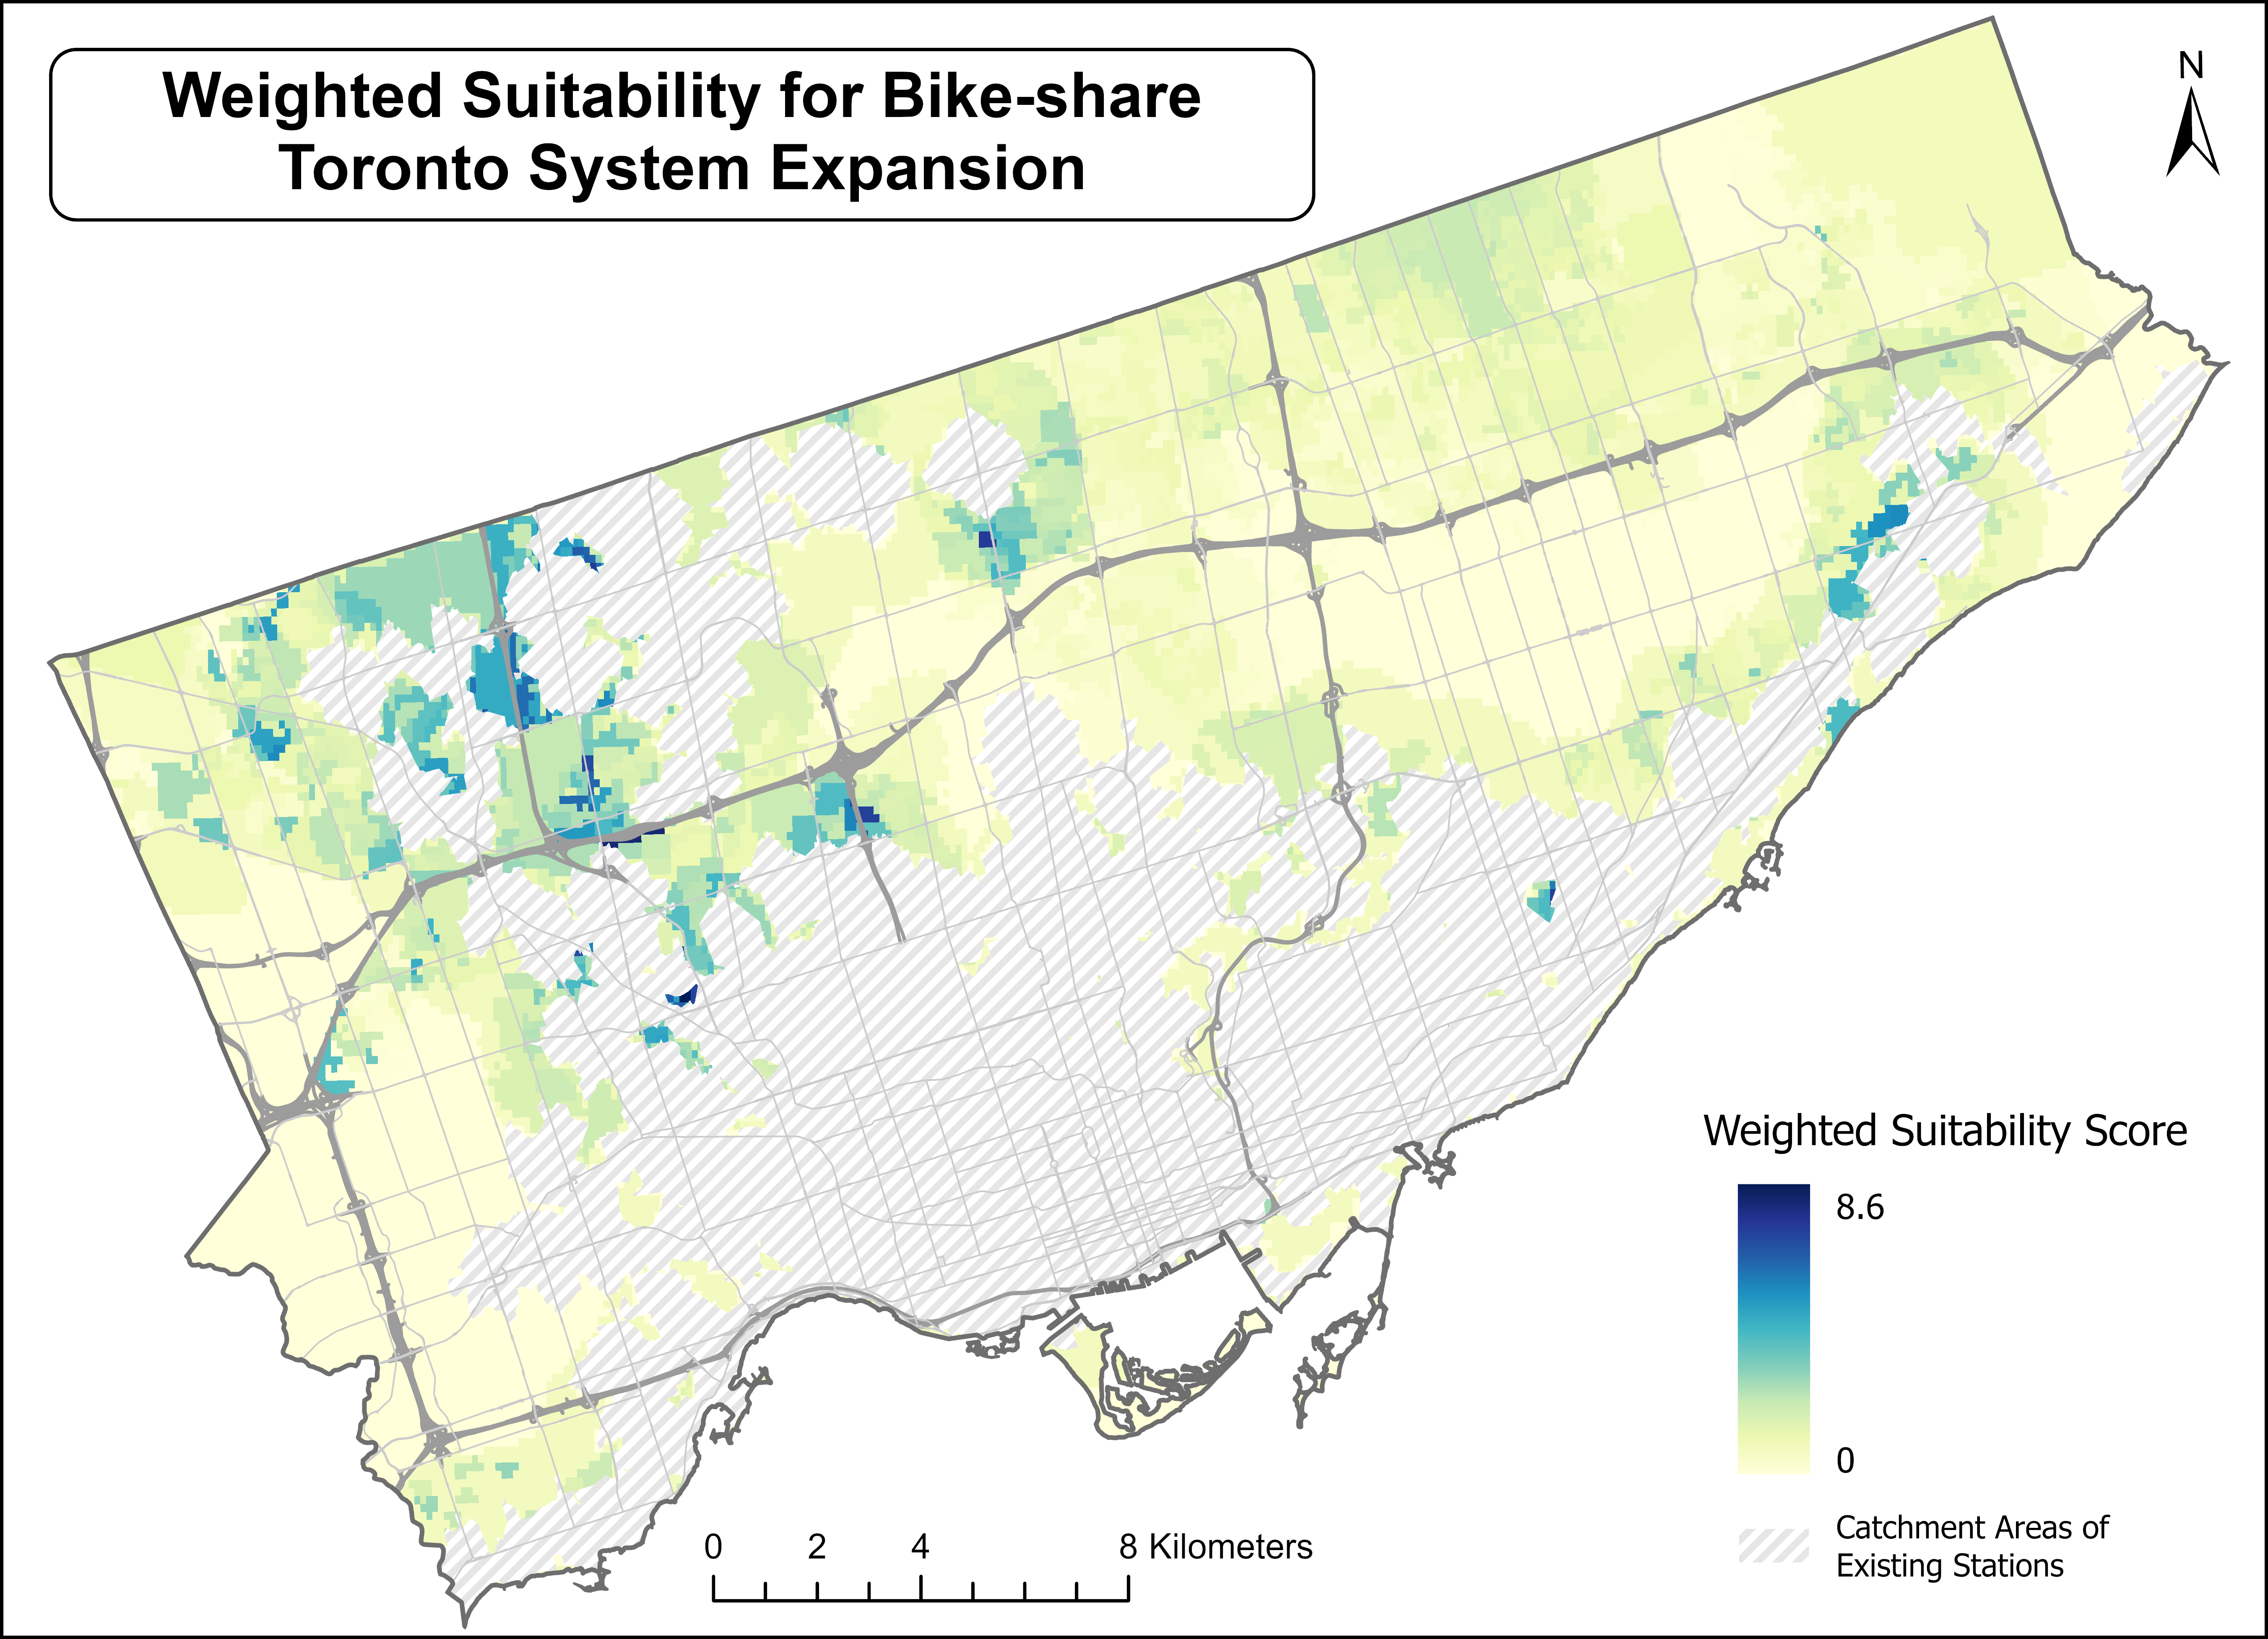
Results and Discussion
Based on the suitability analysis, the areas with the highest suitability scores include Scarborough’s West Hill, North York, Yorkdale, and predominantly the Jane and Finch area.
Our analysis is subject to two primary constraints:
Due to the unavailability of historical data for bike share stations, our study is based on real-time station data accessed on January 8, 2024.
The delineation of non-overlapping catchment areas was performed using Euclidean distance.
Thanks for Listening!
Please scan the QR code to access an Online Dashboard that summarizes this project.
You can also find the presentation slides, report, and analysis R codes hosted there.
For any questions or further information,
feel free to contact me: