Subway Delay and Bike Share Usage in Toronto
How do subway riders respond to service disruptions? Do they turn to alternative modes like bike share to reach their destinations? This study examines bike share trip data and subway delay records in Toronto to determine whether bike share mitigates service disruptions and enhances transit system resilience.
As part of the 2025 ECCE App Challenge, we analyzed the relationship between subway delays and bike share ridership. Our findings indicate a surge in bike share usage following subway service disruptions. However, alarmingly, increased bike share ridership is also associated with a rise in traffic collisions.
Data sources
Below are the data sources used in the data analysis component of the app challenge. Note that the Toronto city boundary is utilized solely in the Shiny app data visualization but not in the modeling component.
| Data Name | URL | Date |
|---|---|---|
| TTC Subway Delay Data | https://open.toronto.ca/dataset/ttc-subway-delay-data/ | 2025-03-21 |
| About TTC Routes and Schedules | https://open.toronto.ca/dataset/ttc-routes-and-schedules/ | 2025-03-21 |
| Bike Share Toronto | https://tor.publicbikesystem.net/ube/gbfs/v1/en/station_information/ | 2025-03-21 |
| Bike Share Toronto Ridership Data | https://open.toronto.ca/dataset/bike-share-toronto-ridership-data/ | 2025-03-21 |
| Traffic Collisions Open Data | https://data.torontopolice.on.ca/datasets/TorontoPS::traffic-collisions-open-data-asr-t-tbl-001/about/ | 2025-03-22 |
| Regional Municipal Boundary | https://open.toronto.ca/dataset/regional-municipal-boundary/ | 2025-03-26 |
Method
The study period is September 2024, and the study area covers the service area of the Toronto Bike Share system. This area is defined by creating a 200-meter buffer around all bike share stations, followed by the creation of a concave hull with a convex fraction of 0.05 to exclude regions without bike share stations. Subsequently, a hexagonal grid is generated with cells having a distance of 500 meters between opposing edges. Temporal dimensions are incorporated at 3-hour intervals, forming space-time hexagonal cubes.
For each space-time hexagon cube, the following metrics are calculated:
- Total number of bike share trip starts.
- Subway delay minutes.
- Number of traffic collisions.
Two-way fixed-effect linear regression model and linear probability model are applied as follows:
- To model bike share trip starts and subway delay minutes: \[\log(\text{bikeshare}_{it} + 1) = \sum \alpha_i + \sum \gamma_t + \beta_1 \text{subway delay}_{it} + \epsilon_{it}\]
- To model the presence of traffic collisions and bike share trip starts: \[I(\text{collision}_{it} \geq 1) = \sum \alpha_i + \sum \gamma_t + \beta_1 \text{bikeshare}_{it} + \epsilon_{it}\]
Here, \(\alpha_i\) represents the hexagon-specific fixed effect, \(\gamma_t\) represents the time-interval-specific fixed effect, and OLS estimation procedures are employed for both models.
Descriptive statistics
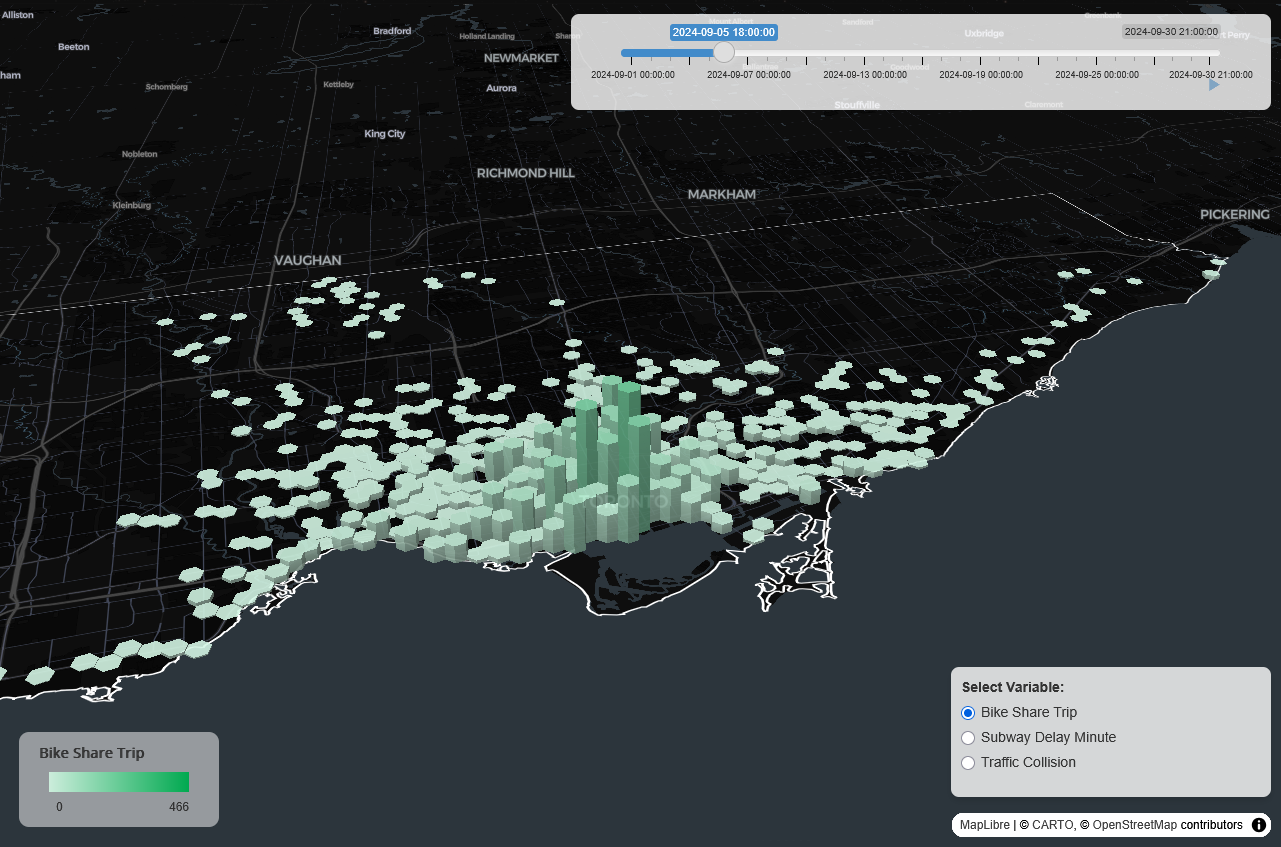
The Shiny app below visualizes bike share ridership, subway delays, and traffic collisions. Click the image or follow this link to explore the interactive map.
The figures below illustrate the average temporal variations in the 3 variables across the hexagonal grid at 3-hour intervals.
Modelling results
| \(log(\text{bikeshare}_{it} + 1)\) | \(I(\text{collision}_{it} \ge 1)\) | |
|---|---|---|
| Subway Delay Minute | 0.0035888 (0.0017486) | |
| Bike Share Trip Start | 0.000348867 (0.00003176907) | |
| Two-way Fixed Effects | \(\checkmark\) | \(\checkmark\) |
| \(R^2\) | 0.7934377 | 0.0268775 |
Scenario simulation
We conducted a scenario analysis where an additional 30-minute subway delay was introduced system-wide. The predicted bike share ridership increased significantly under this simulated disruption.
Conclusions
- Both Subway Delay minutes and Bike Share trip starts are significant at the commonly-used 5% significance level.
- An increase in subway delays (holding all else constant) correlates with an increase in bike share trip starts. Similarly, an increase in bike share trip starts (holding all else constant) corresponds to a higher probability of traffic collisions.
- Two-way fixed effects control for variables that remain constant across either space or time, including temporal trends (e.g., weekends) and built environment factors (e.g., land use characteristics).
Model evaluation
- The model predicting \(\log(\text{bikeshare}_{it} + 1)\) achieves an \(R^2\) close to 0.8, indicating strong explanatory power.
- The linear probability model predicting collisions has an \(R^2\) of approximately 0.03. Traffic collisions are rare and inherently random, meaning that the deterministic component of the process is theoretically small relative to the random component. Therefore, although the model does not explain much of the total variation, it remains informative, demonstrating a positive correlation between bike share ridership and traffic collisions.